1-EU TRADING PLAN.
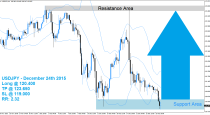
The eurodollar finally strongly broke down last Thursday a range it has entered into on January the 27th. The pair now trades around the 1,12 value.
EU DAILY CHART.
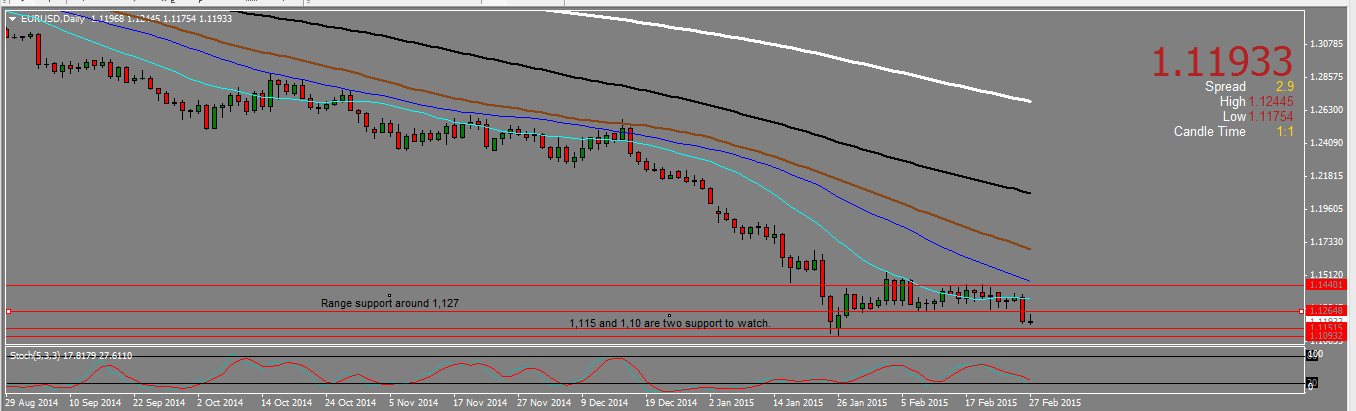
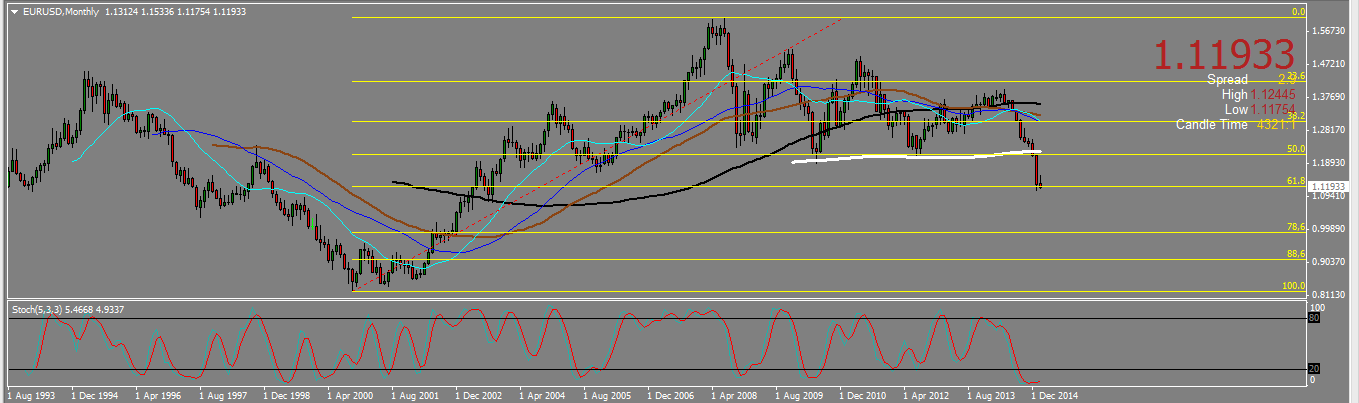
As we broke a range that held so long, the logical thing to do is to be bearish, all the more as fundamentals would support such a move. Therefore on H4 we will sell rallies, as long as we stay under the range support around 1,1265-1,127. Watch out however for the last lows at 1,115 and 1,1. On the monthly, we are against a 61,8 fib level and we broke down before that an important level (50 fib line + monthly SMA200) around 1,21 that has not been retested. A bullish consolidation to that level, however unlikely, cannot be entirely discarded.
EU MONTHLY CHART.
2-GU TRADING PLAN.
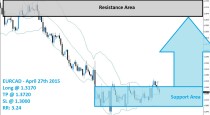
On H4 the cable is on an uptrend, posting higher highs and higher lows. The american dollar strength, as well as an area of resistance around 1,55 1,555 hurt that trend, with a daily bearish engulfing candle posted on Thursday. The following daily candle on Friday was a weak bullish candle, and the pair closed around 1,5340.
GU DAILY CHART.
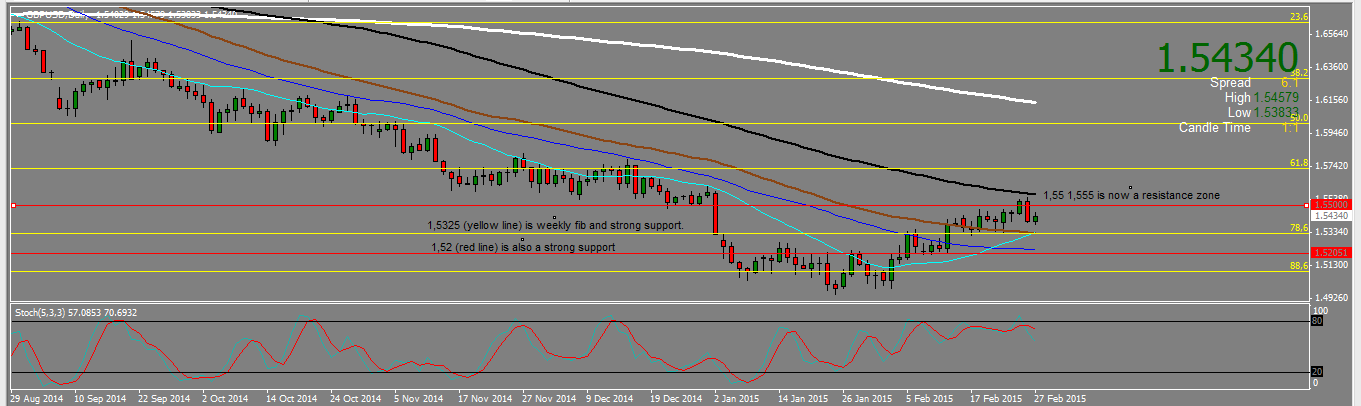
Because of that daily bearish engulfing candle, we are probably going down. The 1,5325 support level is however very strong (weekly fib level with daily SMA55 and SMA20 joining in), and we will still be looking for long entries at that level on the H4 chart. Should that support break, we will look for short, keeping in mind that the 1,52 level that is also a good support.
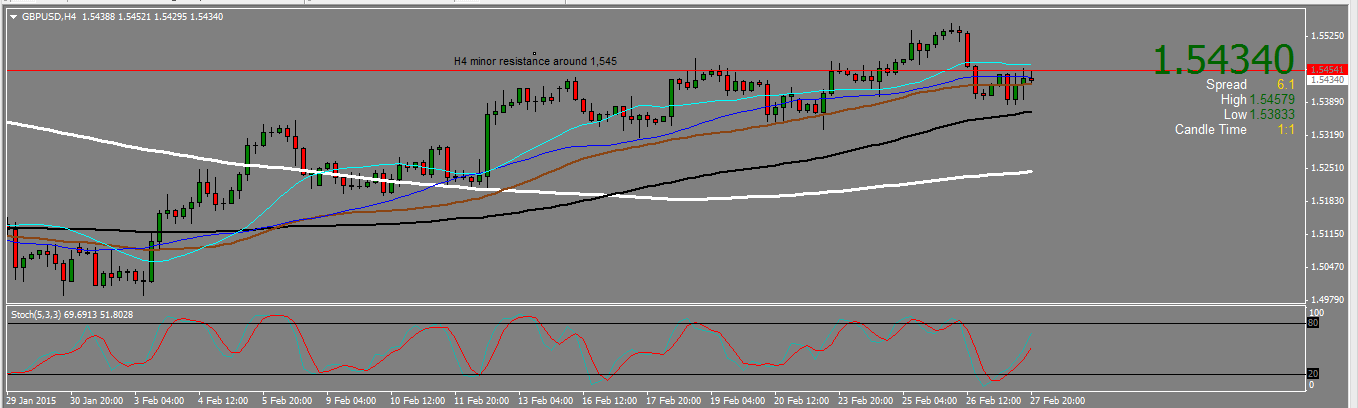
On the long side, a confirmed break out of the minor H4 resistance at 1,545 would be a sign the uptrend may not be over yet. In such a case, we need to wait for a pull back and a signal near that 1,545 level -may be on H1-, in order to be able to protect our trade before getting into the resistance zone around 1,55. The monthly chart (not included), suggests there is some potential on the long side, therefore a bullish break out of the 1,55 1,56 level may happen.
GU H4 CHART.
3-NU TRADING PLAN.
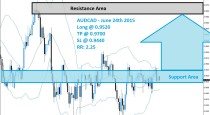
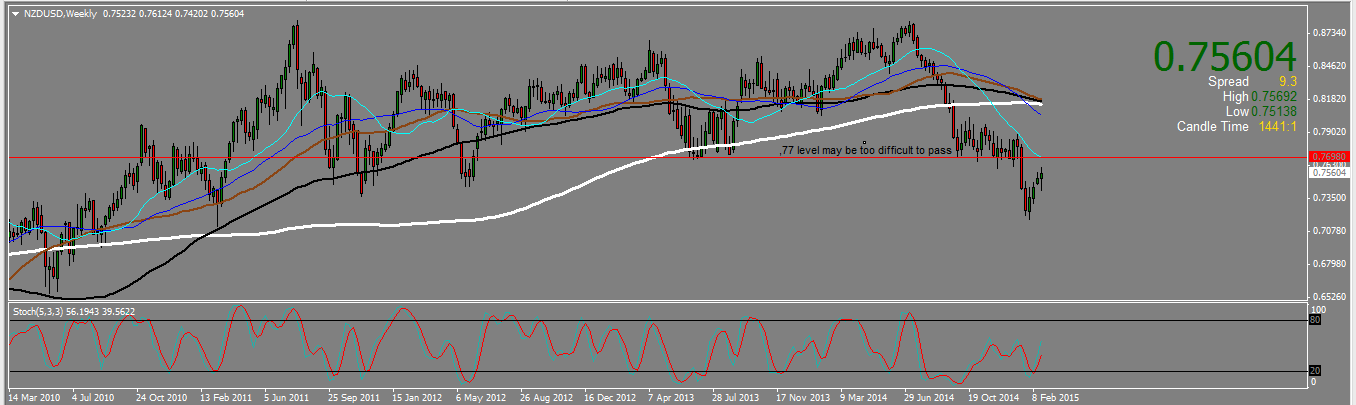
NU is getting stronger and stronger, and some crosses like EURNZD or AUDNZD are near their monthly lows. The pair is however approaching a zone of very strong resistance and it will soon be time to look for shorts.
On the weekly time frame we see the pair was in an uptrend, then went down and broke up the 0,77 level support. It is now trying to retest it.
NU WEEKLY CHART.
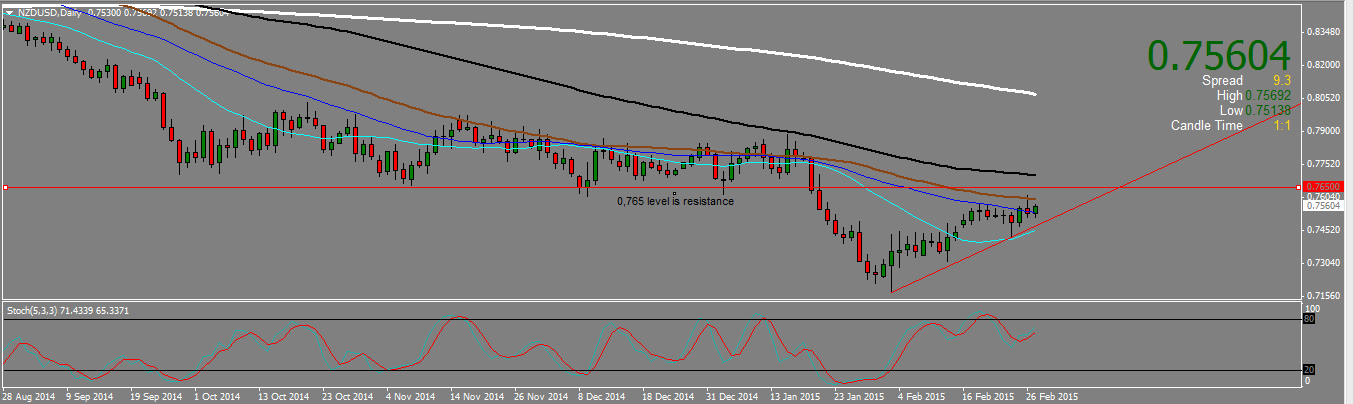
On the daily we see that the pair is in a triangle, and that the resistance is actually starting as soon as the 0,765 level. Therefore on H4 we will be looking for short signals starting from that 0,765 level.
NU DAILY CHART.
 (No Ratings Yet)