
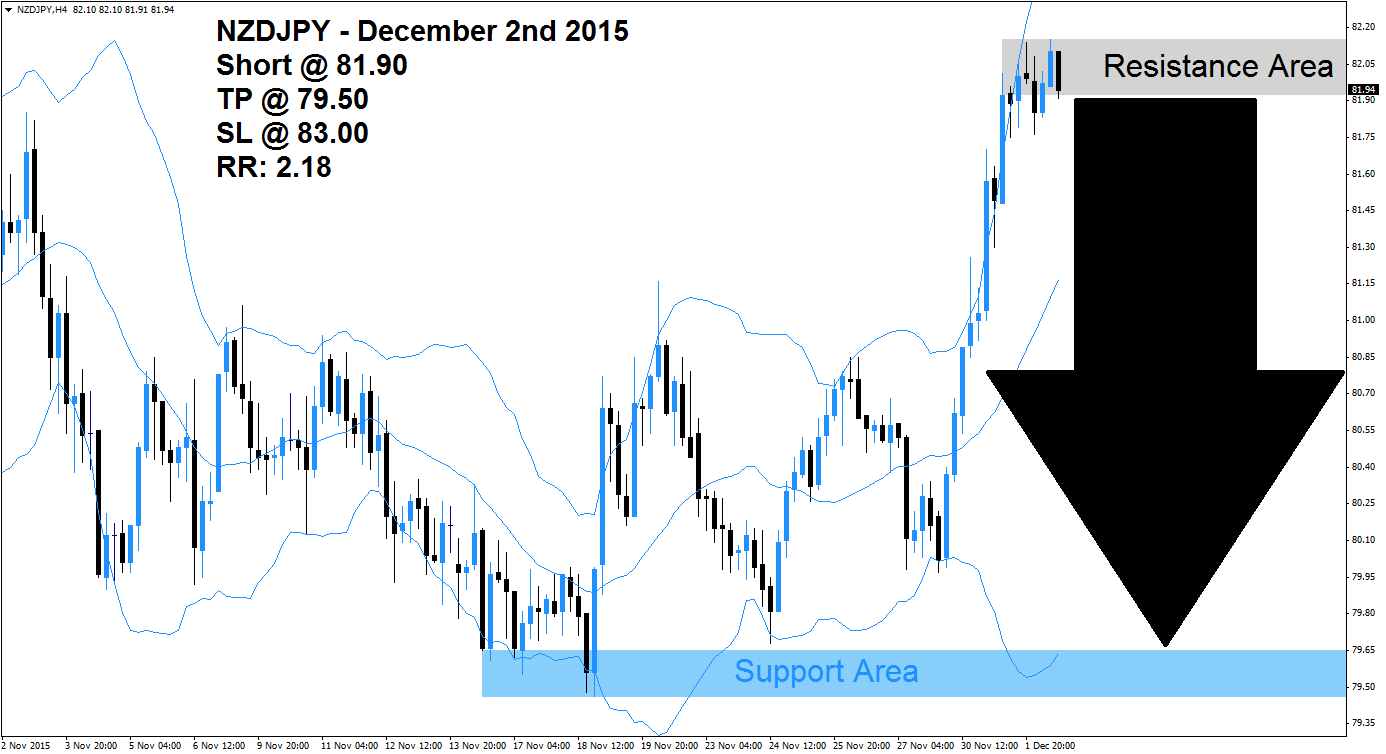
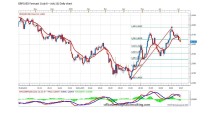
The NZDJPY rallied sharply from its support area which is marked in light blue into its resistance area visible in light grey in the above H4 chart. The Australian Dollar enjoyed a bullish injection following a much better GDP report which powered the rally. The Bollinger Band confirmed the move as all three bands are sloping to the upside, with the upper band currently trading above the resistance area and price action located between the middle band and the upper band.
This currency pair is now vulnerable for a profit taking sell-off after the strong advance as forex traders are likely to lock in floating trading profits following the powerful move. Following a breakdown below the resistance area, new net short positions are expected which will push the NZDJPY further to the downside and a breakdown below the middle Bollinger Band is likely to add more selling pressure for this currency pair.
Forex traders are advised to enter short positions at 81.90 and above in order to be well position for the expected profit taking sell-off in this currency pair and a break in the up-trend. Conservative forex traders should wait for price action to break down below the middle band of its Bollinger Band Indicator which will increase selling pressure. A take profit target of 79.50 has been selected for a potential trading profit of 240 pips.
Forex traders should protect this trade with a stop loss level at 83.00 for a potential trading loss of 110 pips which will result in a Risk-Reward (RR) ratio of 2.18.
NZDJPY
Short @ 81.90
TP @ 79.50
SL @ 83.00
RR: 2.18
Would you like receive more such signals?
($9 per month)

 (1 votes, average: 4.00 out of 5)
Add your review