
Subscribe to Updates (Weekly forex analysis by Stephen L) via Email
The loonie is consolidating within a bullish triangle. If it breaks the resistance near 1,32, mind the daily 200 SMA around 1,33 which could prove resistive too. Buy only confirmed break up.
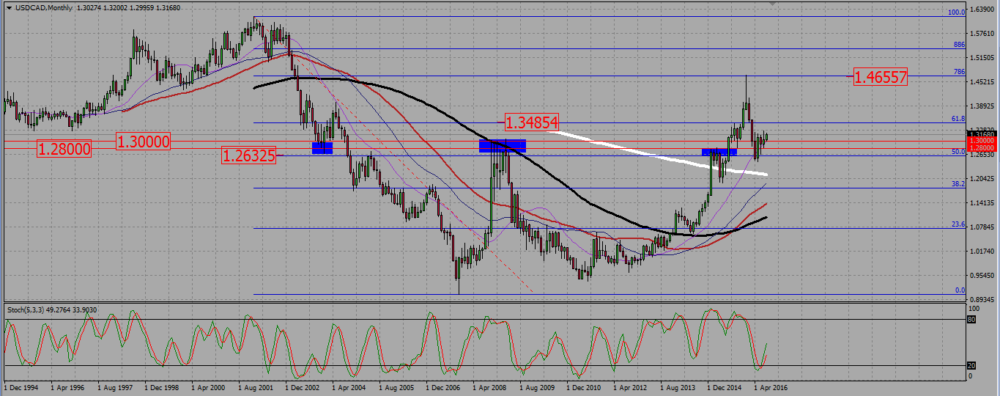
On the monthly chart, the pair trades within a bullish consolidation. It has rejected a support near 1,28 in May this year, and is now slowly climbing up. It even managed to break the 1,30 resistance level. That consolidation however does not look very strong.
USDCAD MONTHLY CHART.
On the weekly chart, the 100 and 200 SMA are in a clear uptrend situation, both pointing up and parallel. However, the pair has been strongly consolidating down between January and May this year, where it rejected the 100 SMA suppport with a strong bullish engulfing candle. Since then it has been slowly drifting up. On that chart, please notice the support around 1,2750. I will keep a rather bullish bias as long as the pair trades above it.
USDCAD WEEKLY CHART.

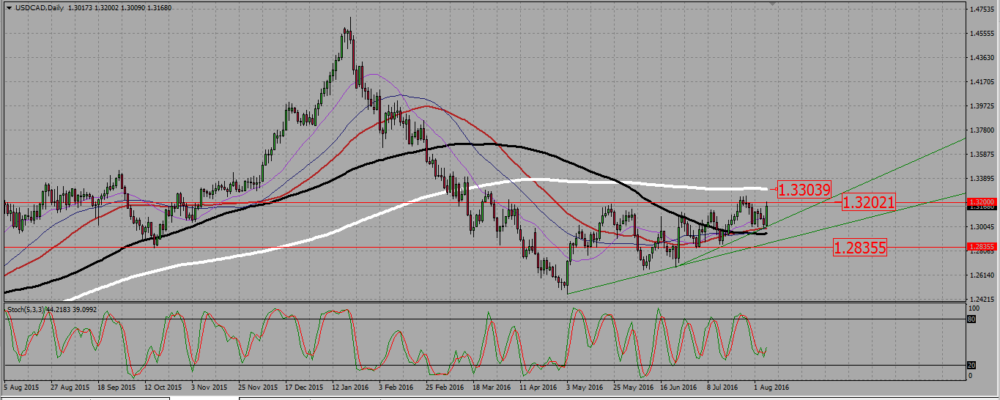
On the daily chart we see that the bullish consolidation the pair is trading within is a bullish triangle. We mat draw two support trend line, a primary (lower) one, and a secondary (upper one). From a technical point of view, both may be used to look for signals, although the primary (lower) one is stronger. Please take note of the 200 SMA near 1,33, that may be troublesome to break up should the pair keep going up. Do not buy a single break up from the 1,32 resistance. And don’t forget about important news next week – US Initial Jobless Claims 11 August, Thursday, 12.30 GMT
USDCAD DAILY CHART.

 (1 votes, average: 4.00 out of 5)
Add your review