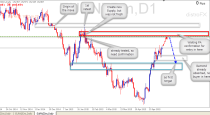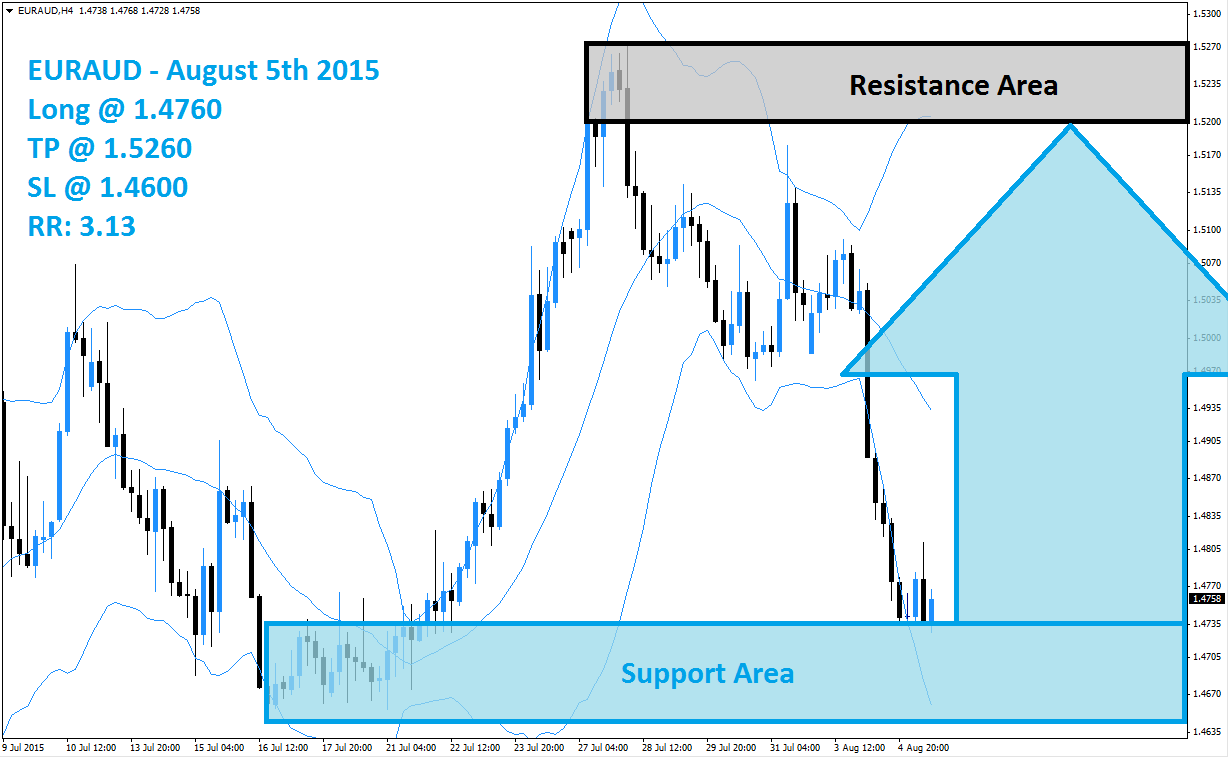
The EURAUD was faced with a sharp sell-off which took this currency pair from its resistance area, marked in light grey in the above H4 chart, down to its support area which is visible in light blue. The strong sell-off follows an equally sharp rally and this currency pair has now formed a double bottom formation; a bullish chart pattern inside of its support area. The Bollinger Band indicator has shown a divergence which is in-line with price action.
The upper band of the Bollinger Band indicator is sloping higher and is trading inside of its resistance area while the lower band is sloping to the downside and trading inside of its support area; the middle band is sloping to the downside as well. Forex traders may opt to realize floating trading profits after the strong sell-off and exit their short positions. This can lead to a short-covering rally and reverse price action one again.
Forex traders are recommended to enter long entry positions at 1.4760 and below this level; this will position their trading accounts to profit from the expected short-covering rally. Conservative forex traders should wait for a breakout above the middle band of it Bollinger Band indicator before entering their long positions. A take profit target of 1.5260 has been set for a potential trading profit of 500 pips on the H4 Chart. More buy orders are expected after this currency pair completes its breakout above the middle Bollinger Band.
Forex traders should protect this trade with a stop loss level at 1.4600 for a potential trading loss of 160 pips which will result in a Risk-Reward (RR) ratio of 3.13.
EURAUD
Long @ 1.4760
TP @ 1.5260
SL @ 1.4600
RR: 3.13
 (No Ratings Yet)