
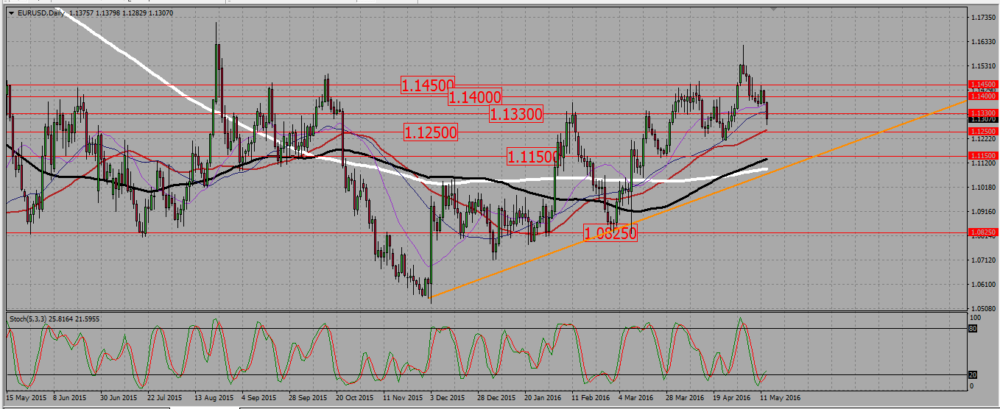
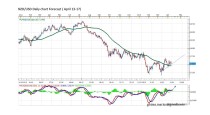
Buy signals above 1,115 towards 1,133 and above. Sell signals under 1,115 towards 1,0825.
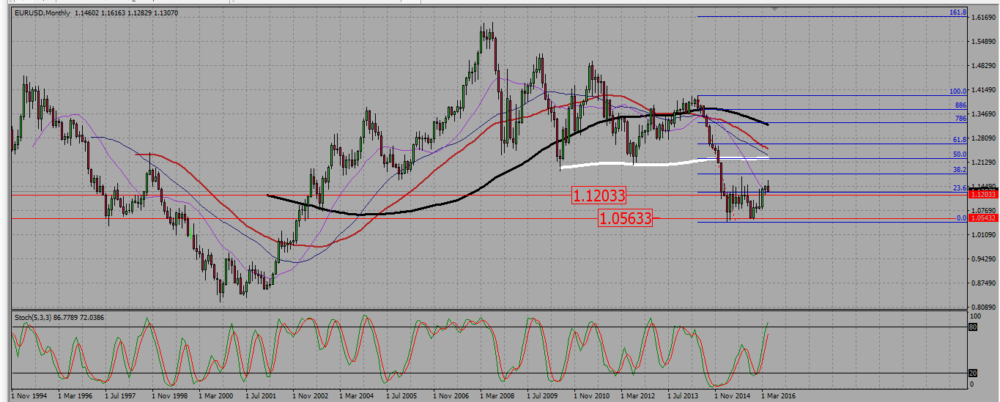
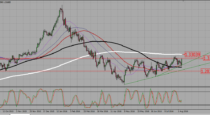
On the monthly chart, after a strong bullish candle in March, and a small bullish pin bar in April -somehow reminding of a bearish harami -, the pair seems to be willing to go down and to retest a broken resistance around 1,12 as a support. As long as the euro stays above that level, I prefer to buy signals.
EURUSD MONTHLY CHART.
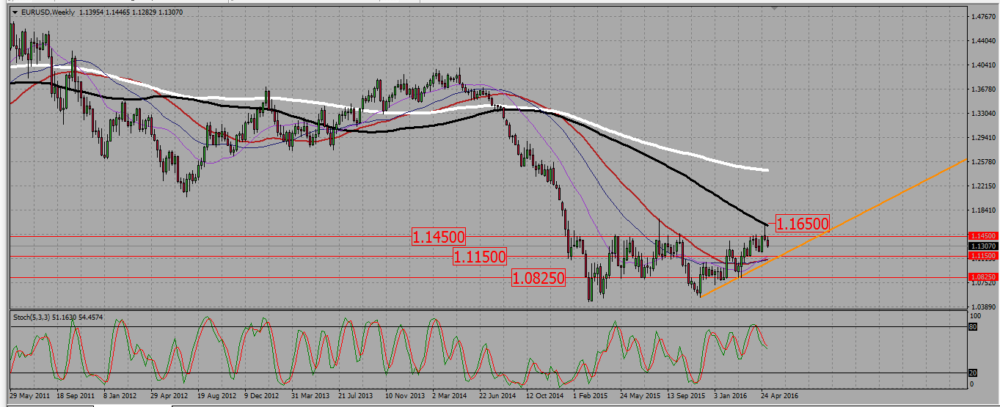
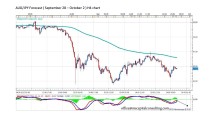
The weekly chart shows the pair rejected the 100 SMA resistance near 1,165, and then went further down with another bearish candle. The euro trades now around 1,13. The broken resistance close to 1,12 we saw on the monthly looks closer to 1,115 on this chart. If this level is broken down, the next support, our potential take profit target, will be around 1,0825. Since September last year the pair has been slowly rising, and we may even draw a trend line to support that move. That line is getting close to the 1,115 support level, making it potentially stronger.
EURUSD WEEKLY CHART.
The daily chart shows the pair in a bearish move/consolidation. Please remember that as long as it does not break down 1,115, the eurodollar is merely retesting a broken resistance as a support, therefore be very cautious if you plan to short it. In order to short it, I want to see it first under that 1,115 level.
EURUSD DAILY CHART.
 (1 votes, average: 5.00 out of 5)
Add your review