
Buy break out of 1,34 and sell rejection of 1,33. Do not swing trade the 1,33 1,34 zone, as it is a monthly resistance zone.
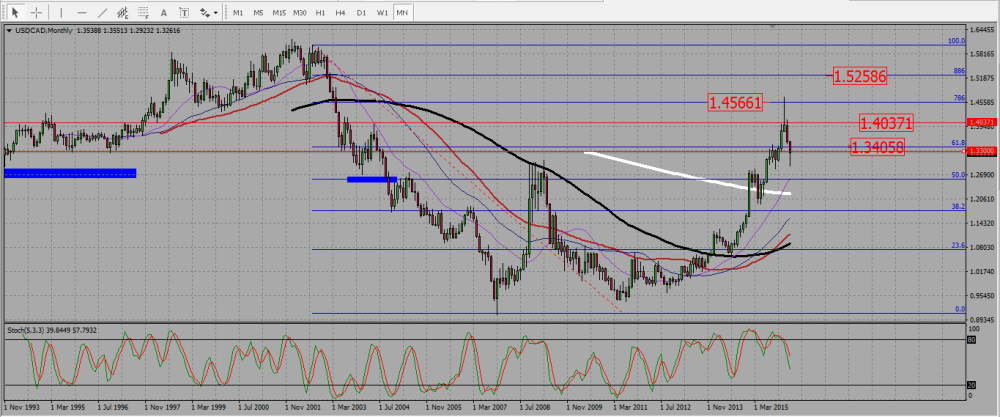
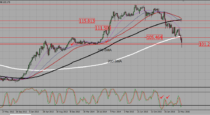
On the monthly chart the pair is ending March with a “hammer style” bearish candle, but the loonie is just under a strong monthly resistance zone between 1,33 and 1,34. The SMAs are somewhat mixed, with the 200 going down, while all others are lining up as in an uptrend.
USDCAD MONTHLY CHART.
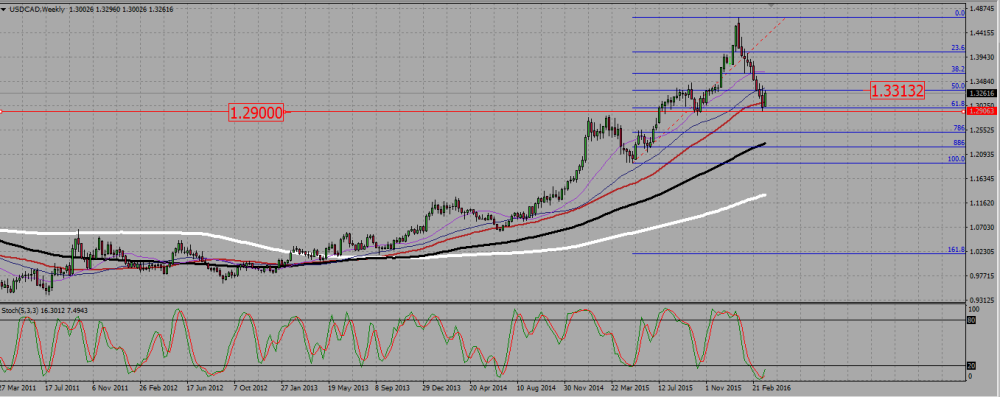
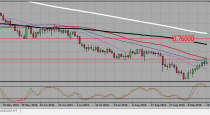
The weekly chart shows an uptrend, with a strong bearish consolidation. The pair seems to have double bottomed on a 61,8 Fibonacci support around 1,29, and it rose by around 350 pips since then. It stands now under the 50 Fib level around 1,33.
USDCAD WEEKLY CHART.
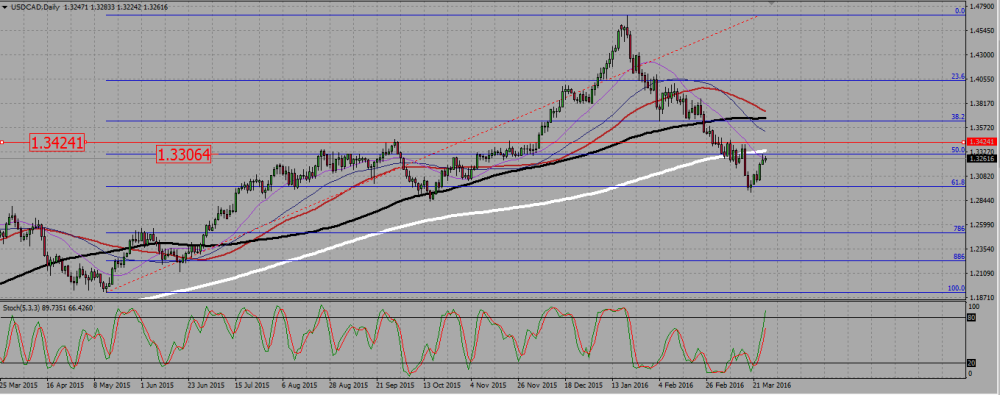
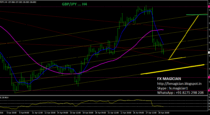
The daily shows the bearish correction, and the pair lurking under the 50 Fibonacci level under 1,33. The 200 SMA is also located there. As we saw the whole area 1,33 1,34 being a resistance, I will buy a break up of 1,333. I consider the whole area 1,33 1,34 as a no trade zone. Buy I would happily sell a rejection to go back to 1,30.
USDCAD DAILY CHART.
 (No Ratings Yet)
Add your review