
USDCAD trading plan.
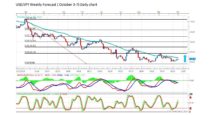
That pair is generally in an uptrend, but it seems to be stalling under a monthly fibo resistance. As long as we are under 1,333 I will rather be looking to sell it. Two strong supports are located at 1,31 and 1,30.
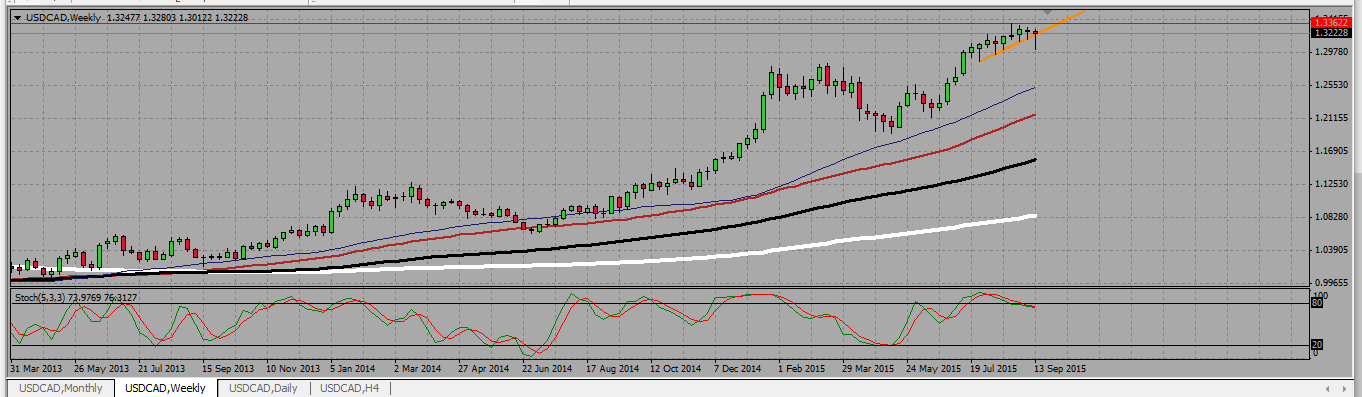
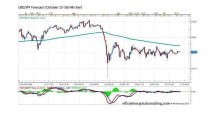
USDCAD weekly chart is turning quite bearish, with a rejection of 1,33 level and the last candle is a hanging man. The SMAs are all pointing up, meaning we are in an uptrend. The pair tried to break down a support trend line, but failed at it, meaning it has some bullish strength left.
USDCAD WEEKLY CHART.
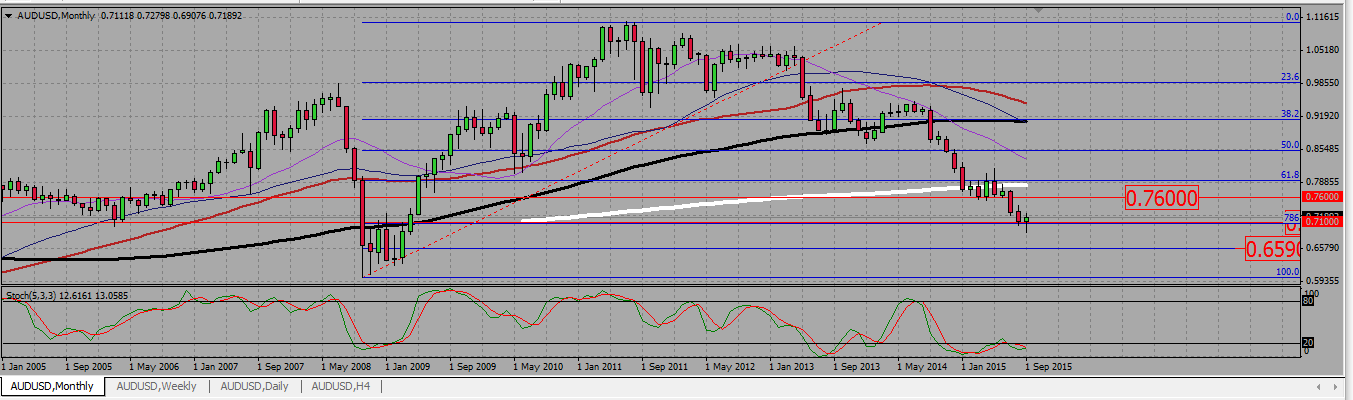
On the monthly, we see that the 1,33 level which has been rejected on the weekly is actually a 61,8 monthly fib line, adding some weight to that level as resistance. Should it however break up, the next resistance level is the 0,786 fib around 1,46.
USDCAD MONTHLY CHART.

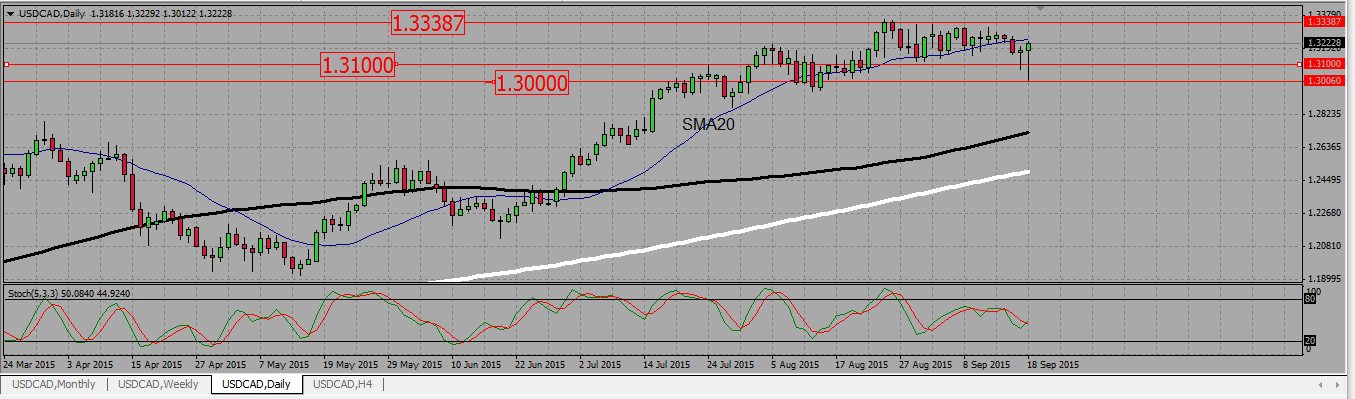
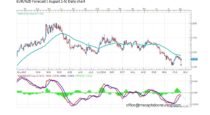
On the daily chart, we see the uptrend, then the rejection of the 1,333 level. The two last candles are making new lows, but both of them are also strongly rejecting supports at 1,31 and 1,30, meaning the bulls still want to fight to push that pair up. However, we USDCAD broke down the daily SMA20, that was a strong support, ant did not take it back. In fact, it is retesting it as a resistance.
I am definitely wishing to sell that pair as long as we are under 1,333. The fact is has still some bullish power left means I have to be very patient and allow for a pull back first before entering short on a resistance. I will definitely not sell a low here.
USDCAD DAILY CHART.
AUDUSD TRADING PLAN.
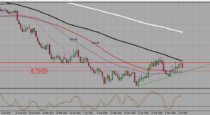
Sell signal under 0,725 to go back to 0,71. Buy above 0,725 to go to 0,76.
On the monthly chart, the pair is going down, but seems to be rejecting the 0,786 fib line support around 0,71. If it goes up, the next resistance is around 0,76
AUDUSD MONTHLY CHART.
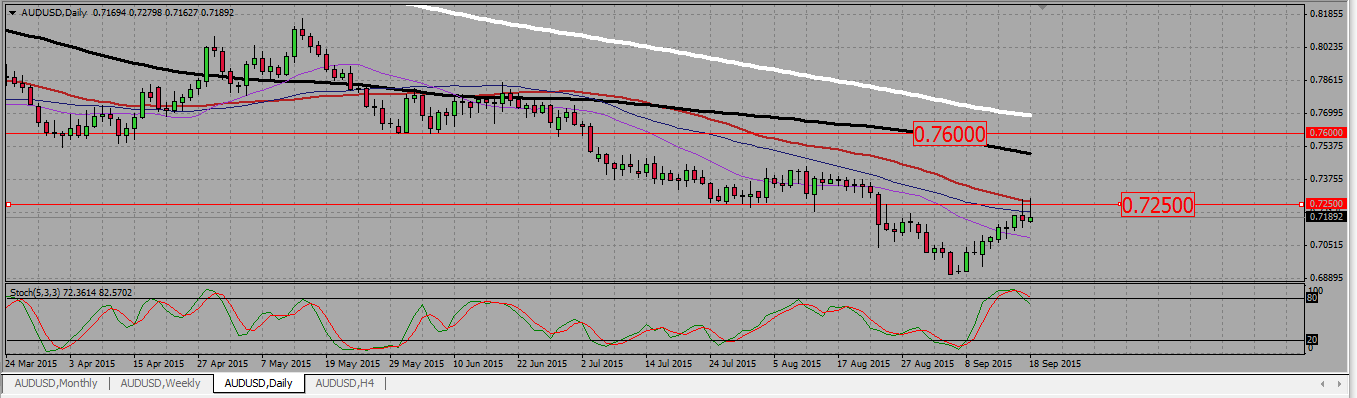
On the daily chart, we see a tweezer top at the 0,725 resistance line. As the main trend is down (notice the 100 and 200 SMA both going down), I will certainly look for selling signals under that level to go back to 0,71, and may be even lower. On the other side a bullish breakout of 0,725 opens the way to 0,76.
AUDUSD DAILY CHART.
 (No Ratings Yet)
Add your review