
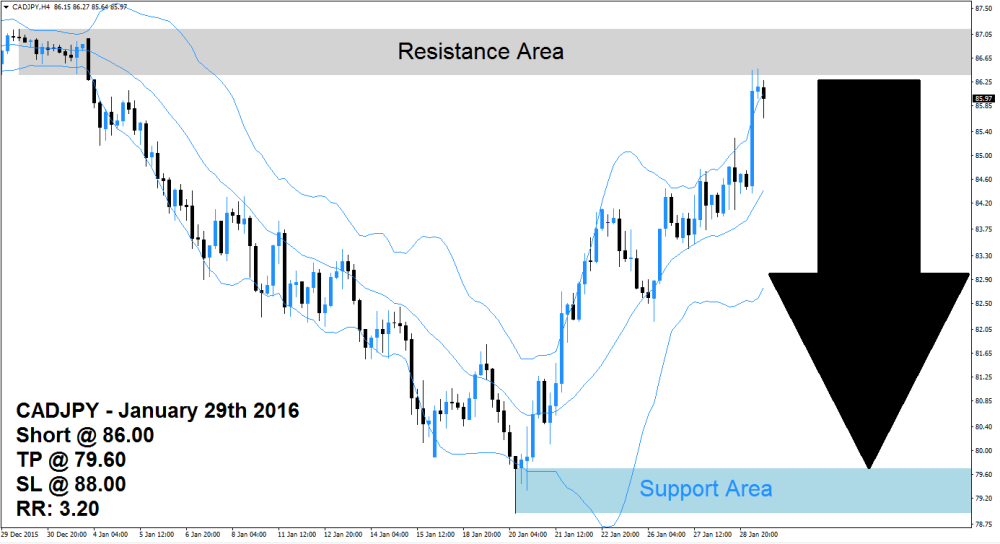
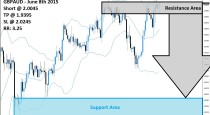
The CADJPY rallied from its support area which is marked in light blue in the above H4 chart until it reached its resistance area which is visible in light grey. The Bollinger Band indicator support the advance an all three bands are sloping to the upside. Price action is located between the middle band and the upper band, but price action started to struggle as the CADJPY reached its resistance area threatening a further advance.
Should this currency pair remain below its resistance area for an extended period, the danger of a pull-back intensifies as forex traders may opt to realize floating trading profits by closing existing long positions. This will force this currency pair lower and a breakdown below the middle Bollinger Band could invite new net short positions. The risk in this trade remains to the downside with limited upside potential
Forex traders are advised to enter short positions at 86.00 and above in order to be well position for the expected profit taking sell-off in this currency pair and a break in the up-trend. Conservative forex traders should wait for price action to break down below the middle band of its Bollinger Band Indicator which will increase selling pressure. A take profit target of 79.60 has been selected for a potential trading profit of 640 pips.
Forex traders should protect this trade with a stop loss level at 88.00 for a potential trading loss of 200pips which will result in a Risk-Reward (RR) ratio of 3.20.
CADJPY
Short @ 86.00
TP @ 79.60
SL @ 88.00
RR: 3.20

 (1 votes, average: 3.00 out of 5)
Add your review