
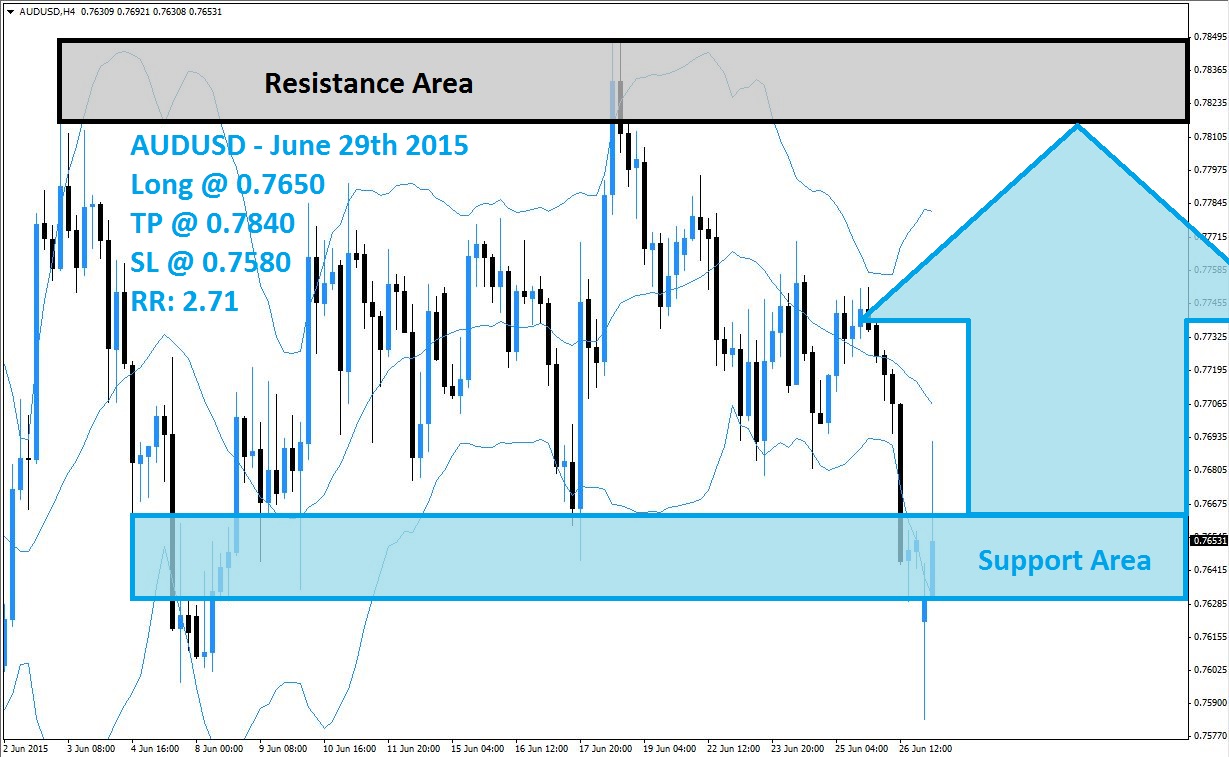
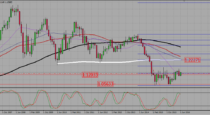
The AUDUSD is trading above and below its support area, which is visible in light blue in the above H4 chart, and this indicates that bullish forces and bearish forces are in a tug-of-war at support. This move was expected, but the volatile trading action also resulted in the Bollinger Band indicator opening up. The upper band is sloping higher while the middle band as well as the lower band is sloping to the downside. More volatility should be expected until the AUDUSD will enter its next trading pattern.
The previous two H4 candlesticks offer a bullish trading signal. The latest candlestick formed an inverted hammer at support and the previous one formed a hammer also at support. This suggests a valid support area and forex traders may opt to realize floating trading profits and exit their short positions. This could lead to a short-covering rally which can take this currency pair above the middle band of its Bollinger Band indicator and result in more buy orders.
Forex traders are advised to seek out long positions at 0.7650 and below in the AUDUSD in order to profit from the expected short-covering rally. Conservative traders are recommended to wait for the breakout above the middle band of its Bollinger Band Indicator before entering this recommended trade. A take profit target of 0.7840 has been set for a potential trading profit of 190 pips on the H4 Chart. More buy orders are likely after the AUDUSD breakouts above its middle Bollinger Band.
Forex traders should protect this trade with a stop loss level at 0.7580 for a potential trading loss of 70 pips which will result in a Risk-Reward (RR) ratio of 2.71.
AUDUSD
Long @ 0.7650
TP @ 0.7840
SL @ 0.7580
RR: 2.71
 (No Ratings Yet)
Add your review