
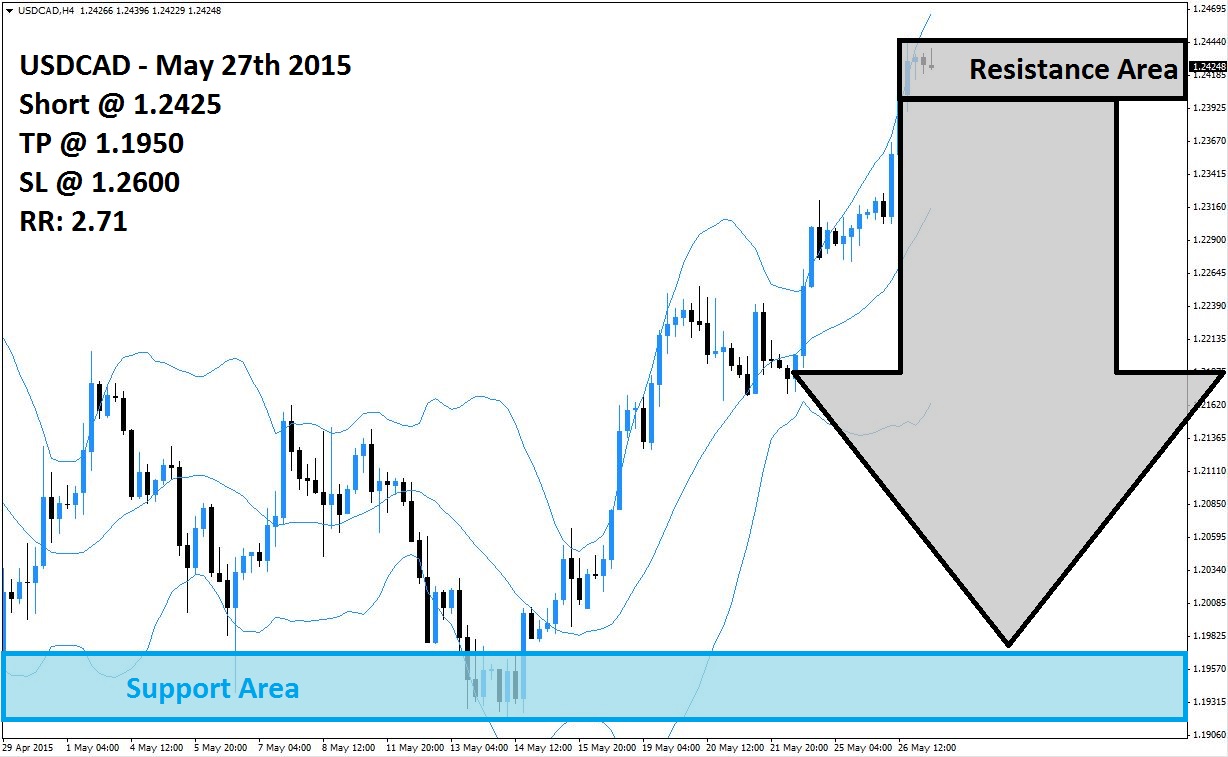
The USDCAD has rallied sharply after trading below 1.2000, but the strong advance has left this currency pair vulnerable for a sell-off as forex traders may opt to realize floating trading profits. The rally took the USDCAD from its support area, visible in light blue in the above H4 chart, to its resistance area which is visible in light grey. The last three candlestick formations suggest that the uptrend may have run out of steam and that forex traders have no desire to add to the rally.
All three Bollinger Bands have support the strong rally and currently slope to the upside. The upper Bollinger Band is trading above its resistance area while the middle and lower Bollinger Bands are trading below it. Forex traders may be faced with choppy sideways trading action which will give the Bollinger Bands a chance to catch up with price action. This will also increase the likelihood of a profit taking which can lead to a breakdown.
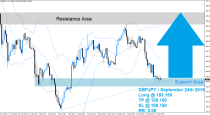
Forex traders are advised to seek short positions at 1.2425 and above in order to be positioned for a breakdown which will lead to a bigger sell-off in the USDCAD. A shift in momentum is suggested by the latest three candlesticks and the highs of the current rally may be already locked in. Conservative forex traders may want to wait for a confirmed breakdown below its resistance area. A take profit target of 1.1950 has been selected for a potential profit of 475 pips.
Forex traders should protect this trade with a stop loss level at 1.2600 for a potential trading loss of 175 pips which will result in a Risk-Reward (RR) ratio of 2.71.
USDCAD
Short @ 1.2425
TP @ 1.1950
SL @ 1.2600
RR: 2.71
 (No Ratings Yet)
Add your review