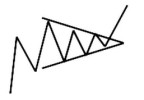
The Harmonic Shark pattern is a relatively new trading pattern that was discovered in 2011 by Scott Carney. The shark pattern is somewhat similar to the crab pattern identified by the overextended swing/pivot point C. The harmonic shark pattern is identified as shown in the picture below and uses 0, X, A, B, C swing points to name the pivot/swing legs and is referred to as a 5-0 pattern.

The main differentiating factor between the Harmonic Shark and other patterns is that it relies on the 88.6% and the 113% reciprocal ratios. Once the price point at D is formed, prices rally or decline very swiftly and therefore it requires active management of the trade. In other words, you simply cannot set up the harmonic shark pattern and come back a while later to trade it as by that time price would have moved a significant distance.
The Shark pattern has the following ratios.
Unlike other harmonic patterns, the trades are entered as follows:
Bearish Shark Pattern – Trade Example
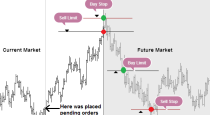
The chart below shows a bearish shark pattern:

The bearish shark pattern above illustrates, especially the entry and exit points. The entry is taken at 88.6% of the OX leg with the target coming in at 61.8% of BC leg. The ratios between the OXABC does not have to be correct to the dot as with most real time trade examples. Another feature of the shark pattern is that it is just as volatile as the harmonic crab pattern. The above chart shows the long range bodies of the candlesticks along with the long spikes that are formed especially near the PRZ zone of C.
Bullish Shark Pattern – Trade Example
The next chart below shows an example of a bullish shark harmonic pattern:

The bullish shark pattern above shows the volatility that is usually formed near the PRZ level of D. In the above example, we notice that the entry at 88.6% was triggered very quickly with the price target at 61.8% being hit within a few candles. In the above example, we also notice that the stop loss levels for the trade were a bit wider. This illustrates the point that while there may be many shark patterns that can be formed, traders would have better success when they only trade the shark patterns that offer a reasonable risk/reward ratio.
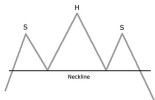
The harmonic shark pattern is distinctive yet different to the typical ‘M’ and ‘W’ shaped other harmonic patterns. The extended AB leg which is the extreme harmonic impulse wave is the most critical aspect for this structure to hold.
The harmonic shark pattern is also a bit complex (and similar to the crab pattern – ? Read more about Harmonic Crab pattern). Therefore traders who are new to harmonic trading should trade the shark pattern only after they have gained considerable experience identifying this pattern on their charts.

 (17 votes, average: 4.12 out of 5)