
1-EURUSD trading plan.
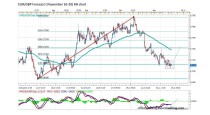
There is no clear trend on the eurodollar. Watch 1,0825 level to go up to 1,1 and then 1,1225, or to fall back to 1,05.
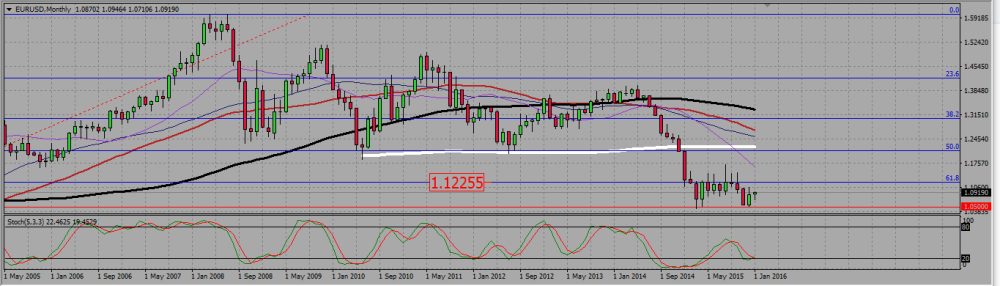
The monthly chart shows the euro ranging from 1,1225 (a 61,8 Fibonacci level) as a resistance and 1,05 as a support. The 200 SMA is flat, and shorter terms SMAs are flat to bearish. The last monthly candle is a piercing pattern, meaning it is not the proper time to think short. It may be the pair will go up to test the resistance at 1,1225.
EURUSD MONTHLY CHART.
On the weekly chart the SMAs rather suggest a bearish configuration : they are mainly pointing down. However, after reaching a low around 1,046 in January last year, the pair has not been trending, but merely consolidating. That bullish consolidation has been already twice capped by the 55 SMA, and the pair is now getting once again close to it around 1,1, with a 50 Fibonacci resistance level very close. This is surely a resistance you want to watch.
EURUSD WEEKLY CHART.

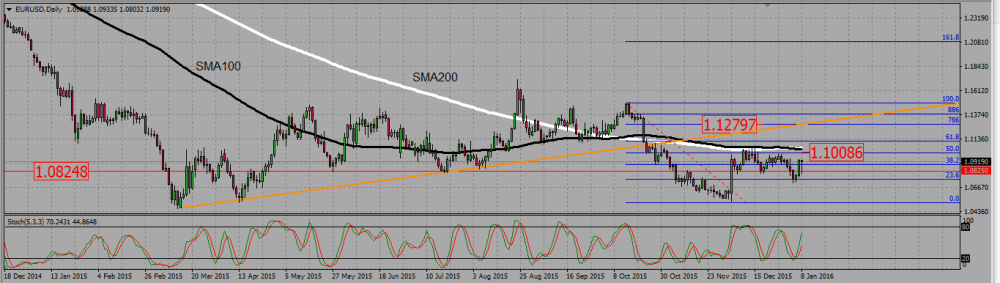
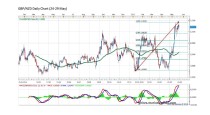
The daily chart shows a very significant level at 1,0825, with numerous bounces and reversals; the pair just failed a bearish break out of that level. I will buy or sell any signal in that area, whether to climb back to 1,1 -and on the daily chart too it is a resistance with both 100 and 200 SMAs nearby, and another Fibonacci level-, or to fall down to retest the 1,05 monthly support level.
EURUSD DAILY CHART.
2-GBUSD trading plan.
Under 1,485, sell rallies towards 1,4325.
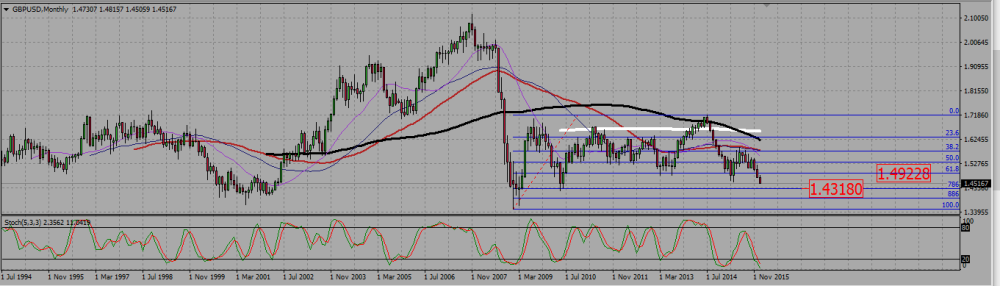
On the monthly chart we see a solid bearish Marubozu for the current month candle. The cable broke a previous low and there is not that much to prevent the pair from falling as low as the 78,6 Fibonacci support level around 1,43.
GBPUSD MONTHLY CHART.
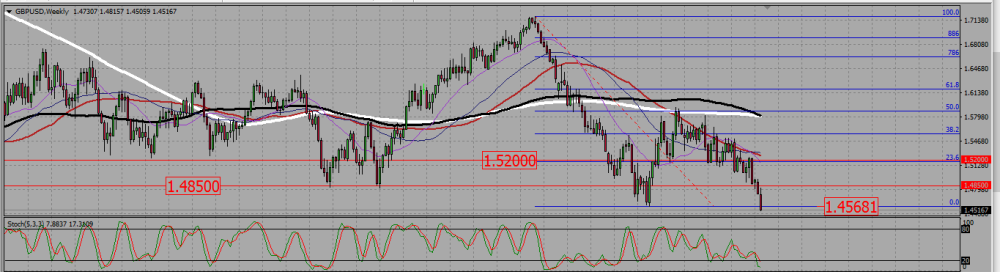
The weekly chart shows us two resistances where I will look for shorts should we get back there : the previous low around 1,455, and a higher level around 1,485. There are some more even higher, but to reach 1,485 would already mean a more than 300 pips bullish rally, and in that case I would stop thinking bearish on that pair.
GBPUSD WEEKLY CHART.
3-USDCAD trading plan.
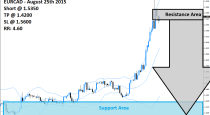
I am still bullish on that pair, that is driven by falling oil price. Above 1,38, buy dips to go back to 1,45.
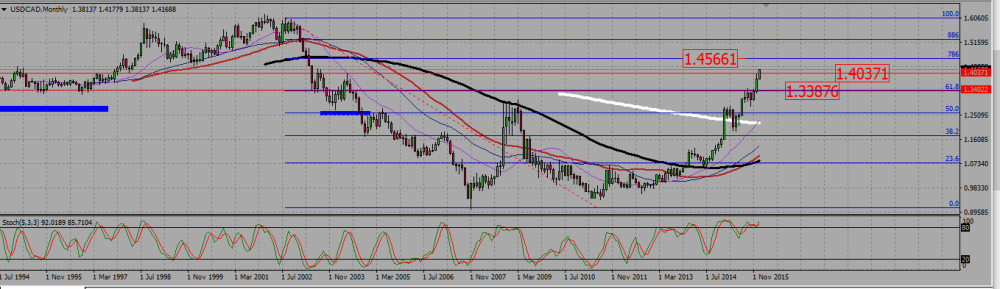
On the monthly chart, we still see the pair going higher after breaking a strong resistance near 1,33 and then a weaker one around 1,4050. It seems to be heading to the 78,6 Fibonacci level around 1,45, and may be even higher.
USDCAD MONTHLY CHART.
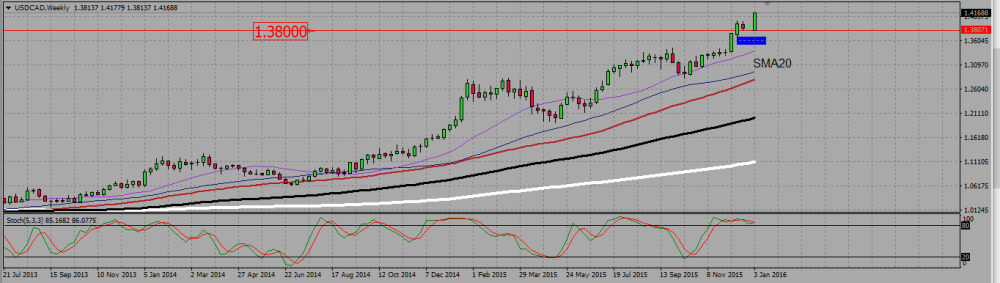
On the weekly chart we see a very strong uptrend. The last consolidation went back to 1,38, and this is the level I do not want to see broken to keep a bullish bias.
USDCAD WEEKLY CHART.
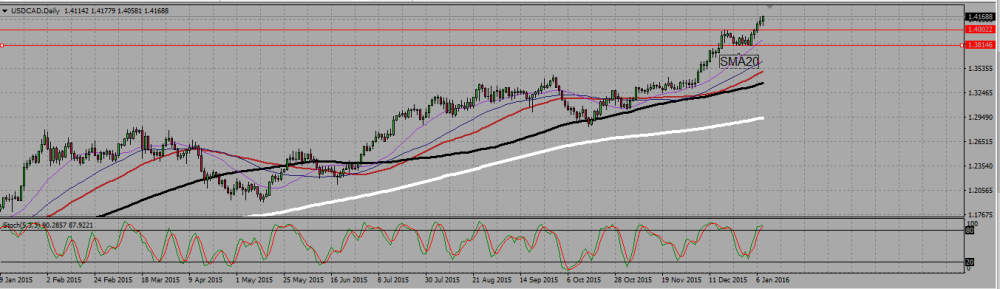
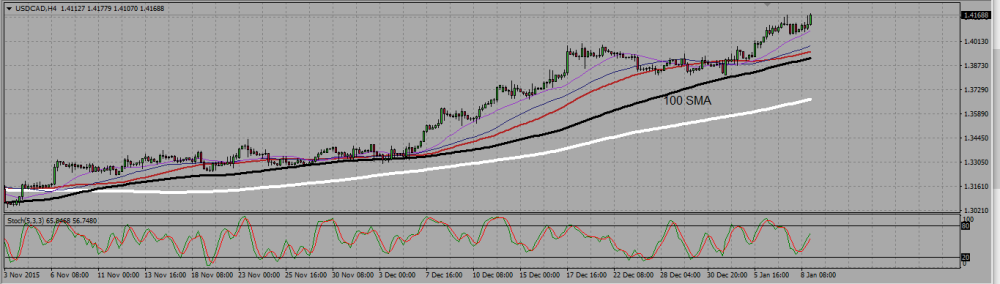
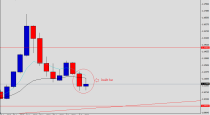
Finally the daily chart shows us the pair ranged a little bit between 1,40 and 1,38 before getting higher. Therefore we do have another support at 1,40 to look for long trades if the pair go back there. Please take note of the 20 daily SMA that acts like it is a support. On H4, the SMA that corresponds to the daily 20 is the 100 SMA, where you should look at for long signals.
USDCAD DAILY CHART.
USDCAD H4 CHART.
 (No Ratings Yet)
Add your review