
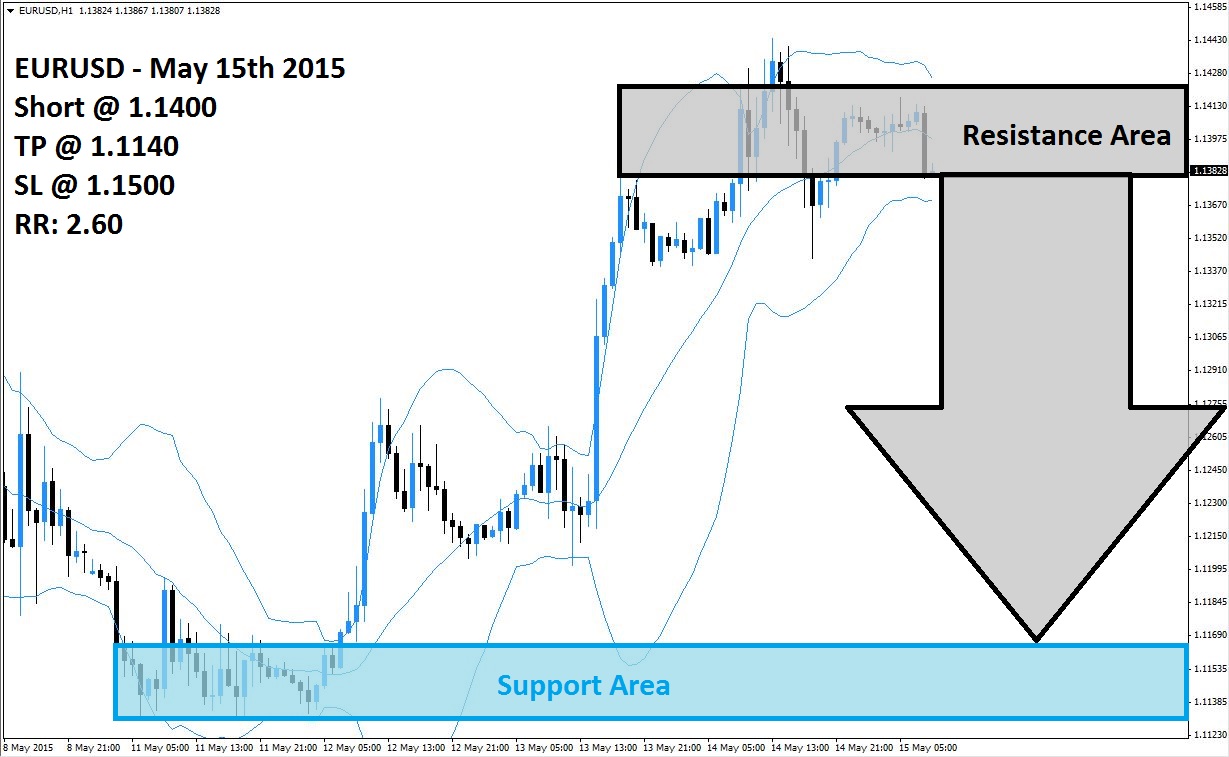
The EURUSD has rallied from its support area, visible in light blue in the above H1 chart, into its resistance area, visible in light grey, from where it started to trend sideways. The 1.1400 mark has established itself as an intermediate resistance level from where a correction should be expected. The sideways trend has allowed the Bollinger Band technical indicator to catch up with price action and is now no longer supporting the rally.
The Bollinger Band indicator is exercising downward pressure on the EURUSD as the upper band, the middle band and the lower band have all started to slope to the downside. This development is expected to lead this currency pair to a breakdown below its resistance area which is expected to initiate a profit taking sell-off as forex traders may opt to realize floating trading profits after a solid rally over the past trading week.
Forex traders are advised to position their trading portfolios with short entries above 1.1400 in order to profit from the collapse of the rally. Forex traders who will miss the initial breakdown can enter short positions once this currency pair rallies in order to test its resistance area before resuming its sell-off. The contraction in price action is likely to increase once the upper band of the Bollinger Band indicator will break down below its resistance area. A take profit target of 1.1140 has been selected for a potential profit of 260 pips.
Forex traders should protect this trade with a stop loss level at 1.1500 for a potential trading loss of 100 pips which will result in a Risk-Reward (RR) ratio of 2.60.
EURUSD
Short @ 1.1400
TP @ 1.1140
SL @ 1.1500
RR: 2.60
 (No Ratings Yet)
Add your review