
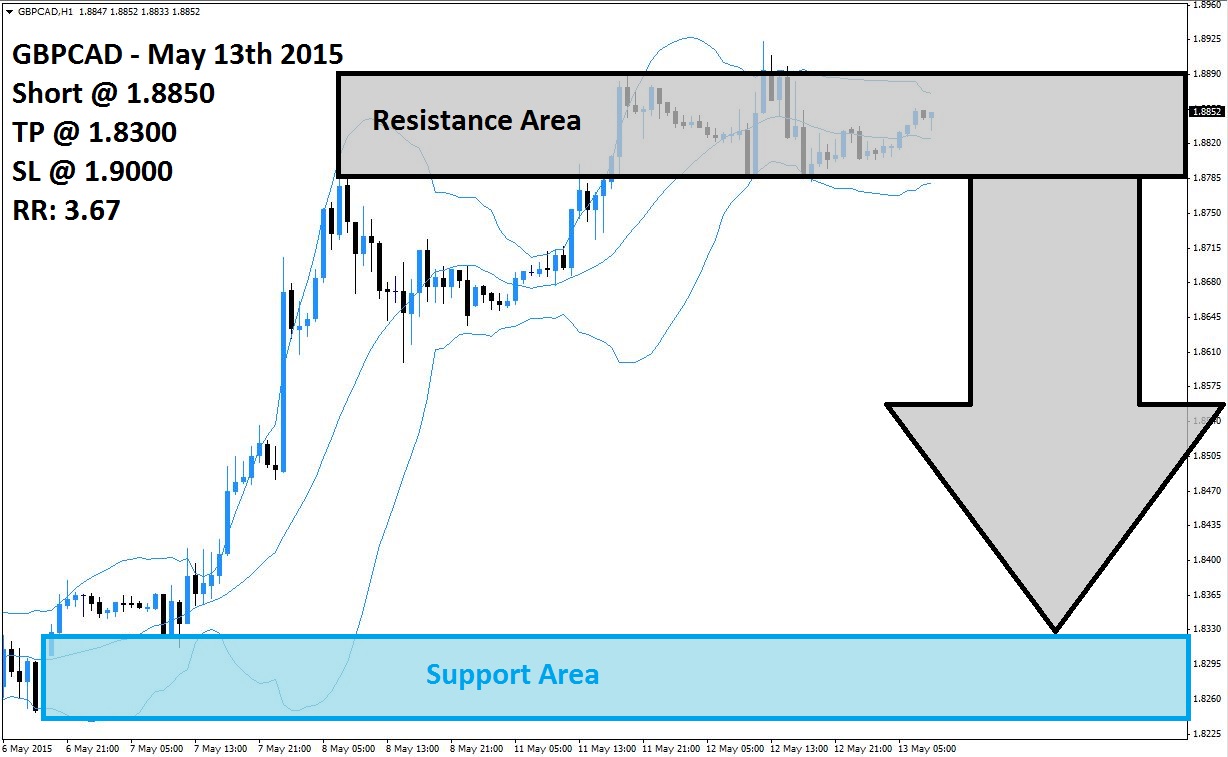
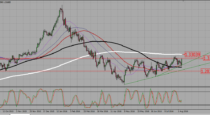
The GBPCAD appears to have exhausted its uptrend is now trading sideways inside of its resistance area which is visible in light grey in the above H1 chart. The sideways trend has caused a contraction in upward momentum and as the Bollinger Band indicator is trading inside of its resistance area as well the risk for a breakdown has increase. The upper band as well as the middle band of its Bollinger Band indicator are increasing downward pressure and will limit any potential upside above 1.8900.
Forex traders may decide to lock in floating trading profits and close their long positions especially if the GBPCAD will remain in its sideways trend with a bias to the downside. A breakdown below its resistance area is expected to lead a profit taking sell-off which could leave this currency pair trading inside of its support area which is visible in light blue in the above chart. A fundamental catalyst could also increase pressure to the downside.
Give the downward bias which is visible in today’s H1 chart, forex trader are recommended to seek out short entries above 1.8850 in order to position their trading portfolios for the breakdown below its resistance area and following sell-off. More conservative forex traders could wait for a confirmed breakdown before entering their short positions in the GBPCAD. A take profit target of 1.1.8300 has been selected for a potential profit of 550 pips.
Forex traders should protect this trade with a stop loss level at 1.9000 for a potential trading loss of 150 pips which will result in a Risk-Reward (RR) ratio of 3.67.
GBPCAD
Short @ 1.8850
TP @ 1.8300
SL @ 1.9000
RR: 3.67

 (1 votes, average: 2.00 out of 5)
Add your review