
EURUSD trading plan.
As long as the pair trades under 1,075, sell signals towards 1,06 and lower. Buy a bullish break out of 1,075 towards 1,0825. Sell a bearish break out of 1,06 to possibly continue a long term bearish move.
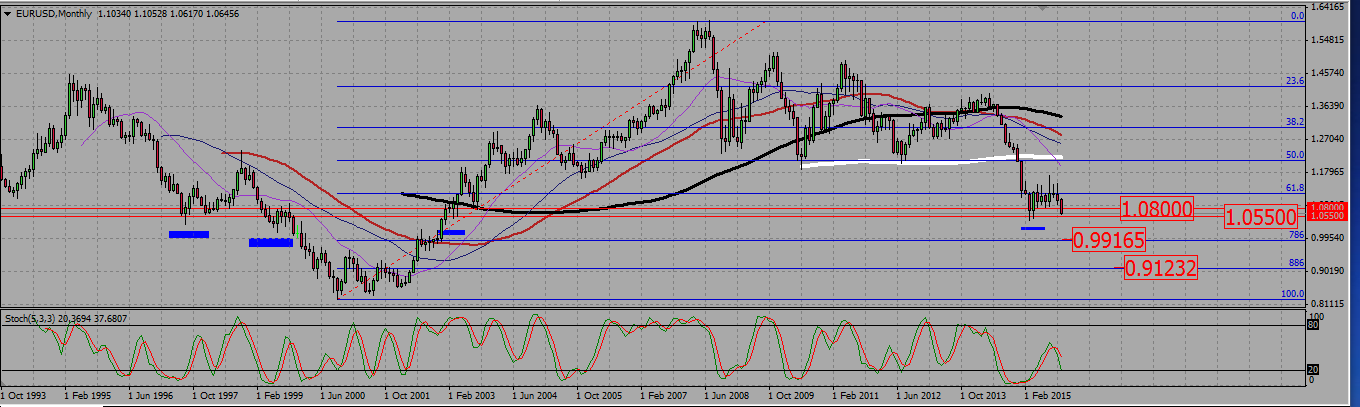
On the monthly chart the EU is indeed going lower, but it is still within a support zone that resisted its last bearish attempt.
EURUSD MONTHLY CHART.
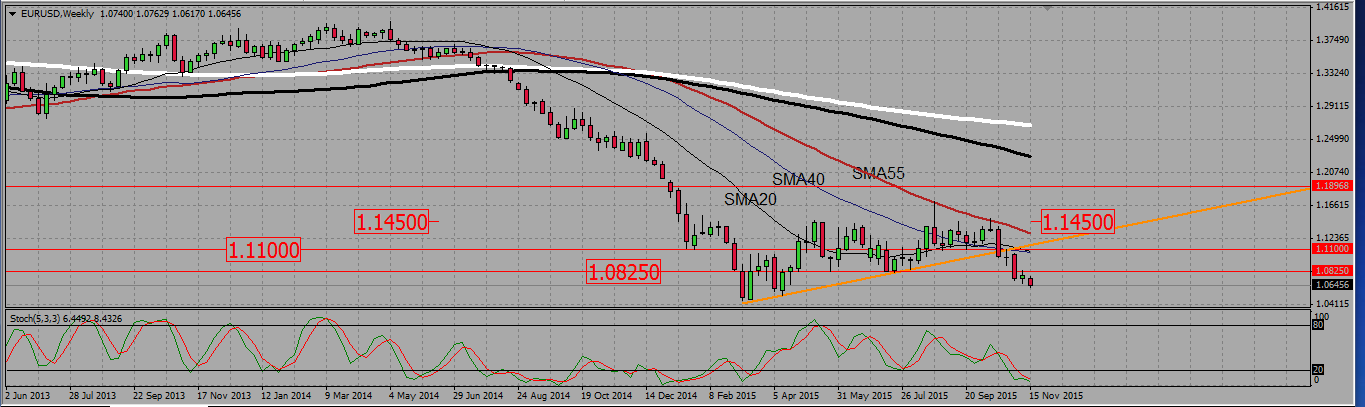
The weekly chart shows, that after breaking down the 1,0825 support, the eurodollar retested it with an indecision candle, and then confirmed the break out with a bearish candle and a new low. This is why I rather want to sell that pair this week.
EURUSD WEEKLY CHART.
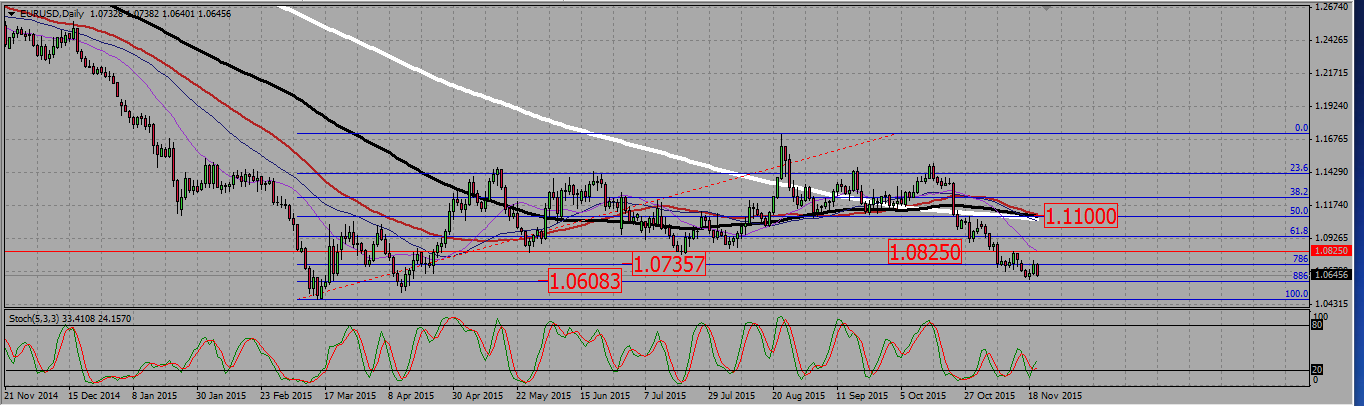
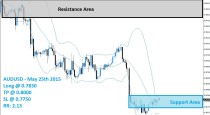
Finally, a look on the daily chart shows the pair making a confirmed breaking down of a 0,786 Fibonacci support around 1,075. This is very significant. I would rather sell rallies into that level, and this will be my stop loss should I enter a short trade near that area. The next support is the 0,886 Fibonacci line, and that is also a critical level. I will closely monitor price action near it , being ready to buy a reversal signal or to sell a confirmed break down.
EURUSD DAILY CHART.
AUDUSD trading plan.
Buy signal above 0,70 towards 0,76.
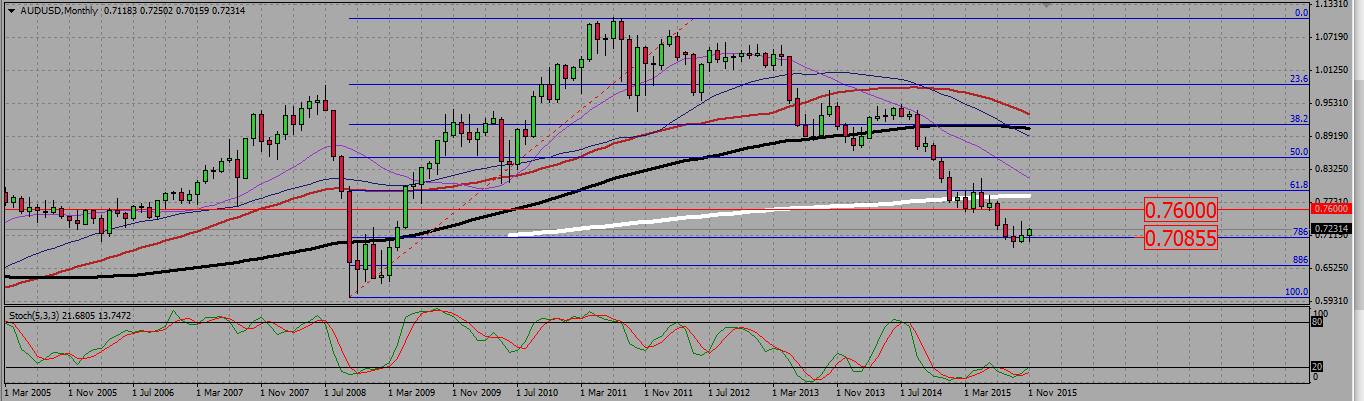
On the monthly chart, the pair seems to be rejecting a 0,786 Fibonacci support near 0,7, with a bullish stochastic divergence. As long as we stay above that level (0,7013, see daily chart), I prefer to buy signals. A strong resistance is located near 0,76 and that will be may take profit level.
AUDUSD MONTHLY CHART.
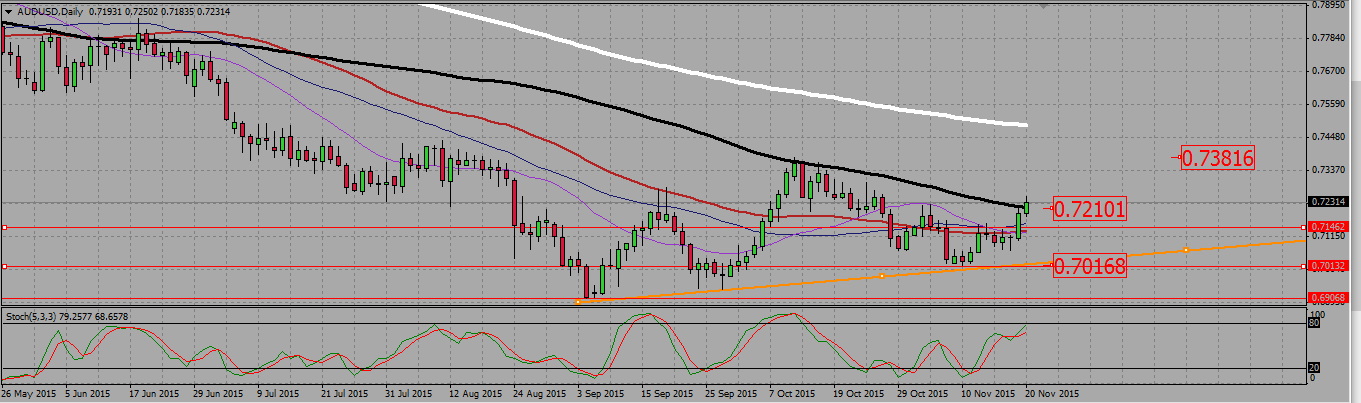
On the daily chart, we see the pair rejecting a low around 0,7013 and then consolidating higher. It even managed to break the 100 SMA, which is now a support where we may look for buying signals, or use as as stop loss level.
AUDUSD DAILY CHART.
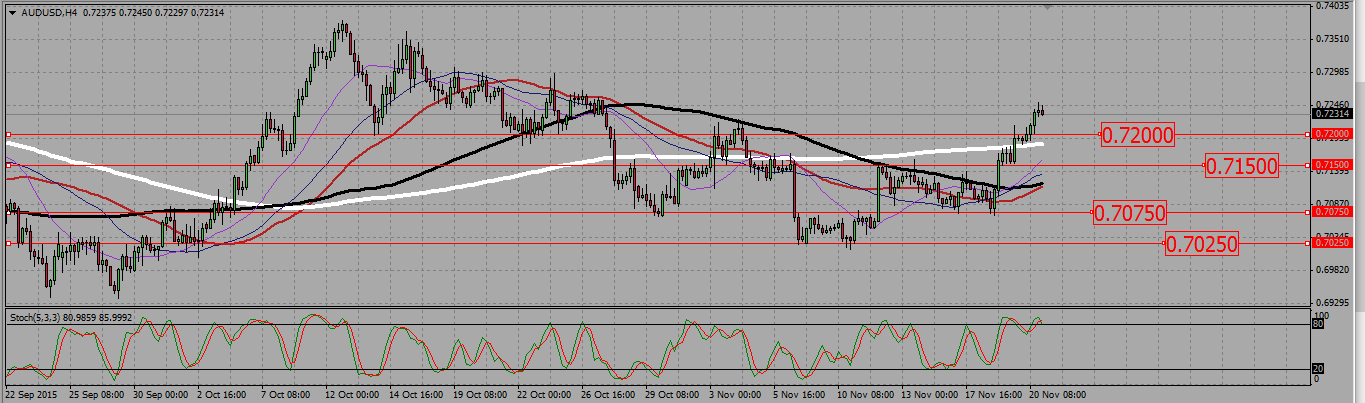
Finally, the H4 chart shows us a few supports I will use to look for buying signals should the pair decide to start the week going down. Those supports are located around 0,72, 0,715, 0,7075, and 0,7025.
AUDUSD H4 CHART.
 (2 votes, average: 5.00 out of 5)
Add your review