
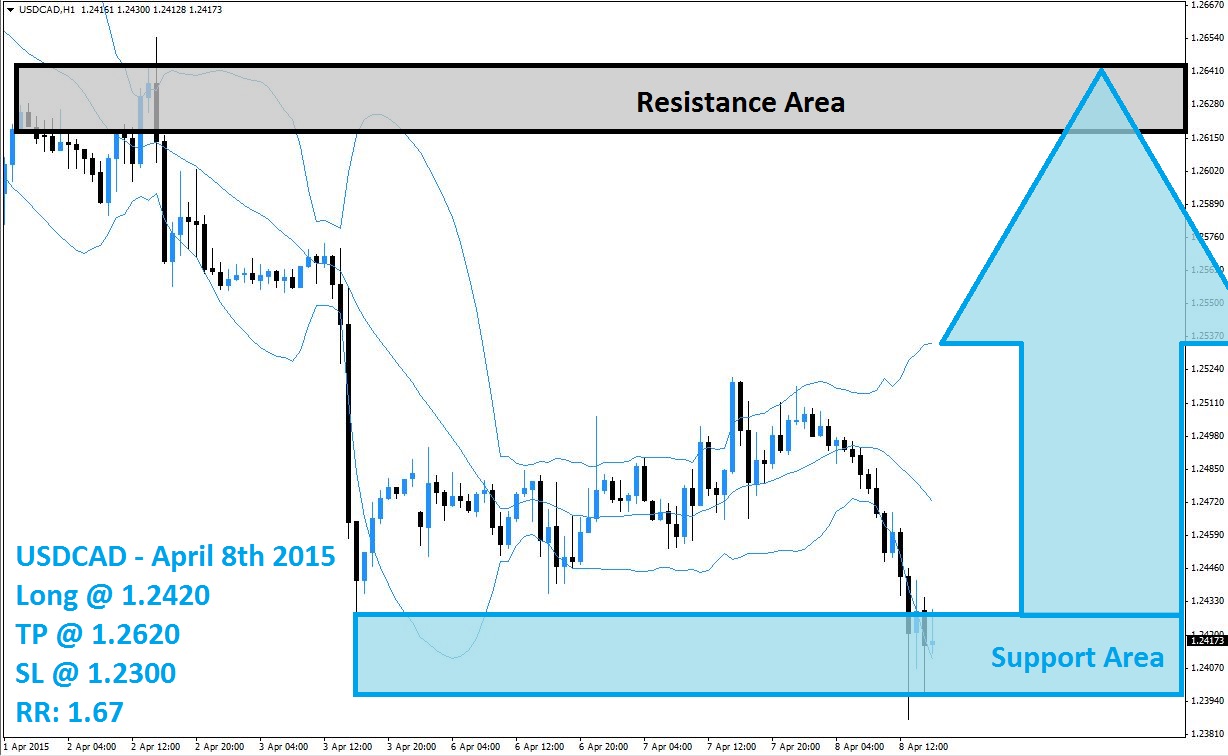
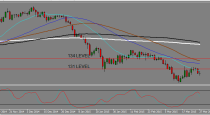
The USDCAD plunged after last Friday’s NFP report forced forex traders to adjust their positions. The US Dollar was positioned for a rally after a previous drop took this currency pair from its resistance area, marked in light grey in the above H1 chart, to the top of support area visible in light blue. The USDCAD recovered from the sell-off and advanced inside of its Bollinger Band indicator. After a failed breakout above the top band met the disappointment out of the NFP report the USDCAD entered a new sell-off.
Prior to the release of the NFP report this currency pair moved from the top band below the middle band which gave a solid bearish signal and forex traders to act on. The sharp sell-off took the USDCAD below the low band and into its support area and into a lower low than the previous sell-off. The Bollinger Band indicator opened up and diverged with the top band moving higher while the middle band as well as low band is moving to the downside.
Forex traders are recommended to seek out long positions in order to profit from the expected short-covering rally. Long positions at 1.2420 and below are preferred and will allow for the biggest upside potential. A take profit target of 1.2620 is recommended for a potential trading profit of 200 pips on the H1 Chart. Watch out for a breakout above the support area as it is likely to increase the magnitude of the short-covering rally.
Forex traders should protect this trade with a stop loss level at 1.2300 for a potential trading loss of 120 pips which will result in a Risk-Reward (RR) ratio of 1.67.
USDCAD
Long @ 1.2420
TP @ 1.2620
SL @ 1.2300
RR: 1.67
 (No Ratings Yet)
Add your review