
The loonie keeps on falling, but it stands now at a strong support zone around 1,3225- 1,345. If it breaks through, it will probably go down to 1,30 and may be 1,27, but watch out for a possible bullish reversal at current level. Enter only crystal clear signal, as the bears are still in firm control of the pair at the moment.
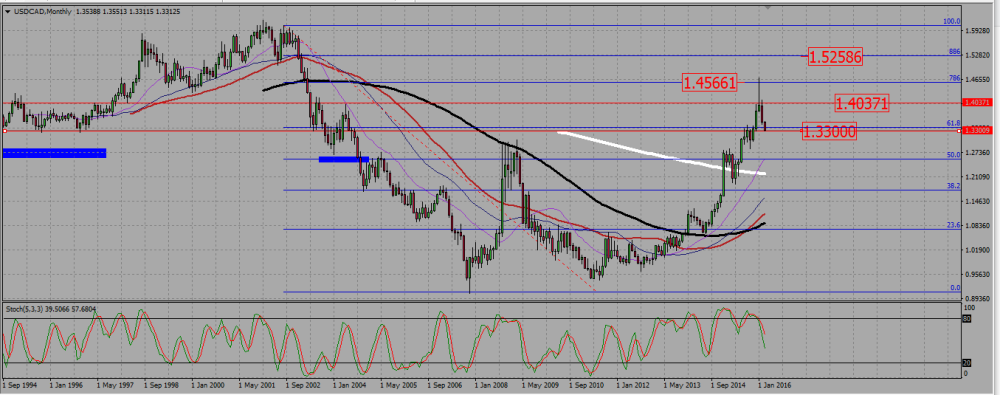
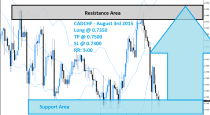
On the monthly chart, the loonie looked like it wanted to rise to the sky, then it made a sharp U-turn around a 0,786 Fibonacci level at 1,455 and started crushing down. It has broken down a support around 1,40, but is now facing an even tougher support zone around 1,32 -1,33.
USDCAD MONTHLY CHART.
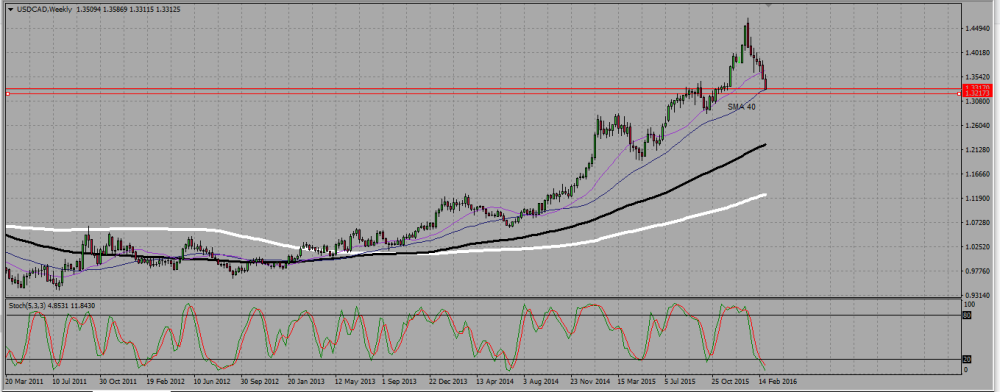
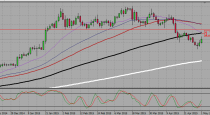
The weekly chart shows an uptrend (SMAs pointing up), with a powerful bearish consolidation. We see the pair resting upon the support zone we identified on the monthly chart. The 40 SMA is just under and we may use that SMA as a support to look for bullish reversal or for a bearish break out and a continuation of the move.
USDCAD WEEKLY CHART.
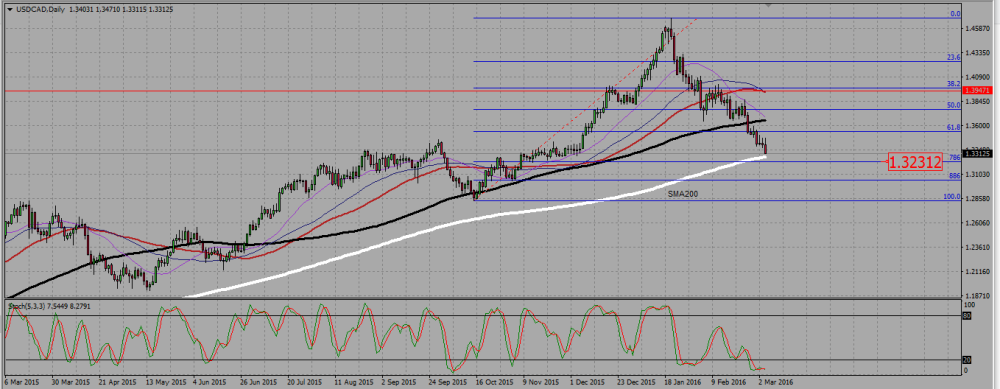
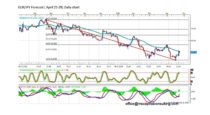
On the daily chart, we see the pair crushing down. That bearish move is very strong, and there are very little down wicks on the candles, meaning the bulls are totally defeated, not even trying to fight back at the moment. But as we are in a strong supporrt zone, I see two supports I will monitor closely, namely the 200 SMA around 1,3275 and a 0,786 Fibonacci support around 1,3225. As we see the bears being in total control of that market, I need a very strong reversal signal here -something like a clear hammer or a strong bullish engulfing candle – to enter long.
USDCAD DAILY CHART.
 (1 votes, average: 5.00 out of 5)
Add your review