
TABLE OF CONTENTS:
Cash Flow Channels– another free system by Vladimir Ribakov. This strategy is a part of Forex Libra Code. Cash Flow Channels is designed to be traded on the 4 Hour and the 1 Hour timeframes and can be applied to all currency pairs. The system relies on determining the trading direction on the Daily timeframe while entries occur on the 4 Hour or the 1 Hour timeframes.
Download free Cash Flow Channels >>
The indicators of Cash Flow Channels are easy to read so you simply need to watch the charts and take action when price enters the Buy and Sell action zones. The system uses a 2:1 Reward/Risk Ratio which means that you will earn twice as much as you risk on each trade.
We advice you trade this system on a basket of currency pairs and but if you are still new to trading I recommend that you focus on trading the Major currency pairs. As you gain more experience trading this system you can monitor more currency pairs.
In the following chapters you will learn all about the Cash Flow Channels system indicators, how to identify Buy and Sell trade opportunities and see why this system is one of my all-time favorites.
Once the Cash Flow Channels template has been applied successfully, your chart will look similar to this
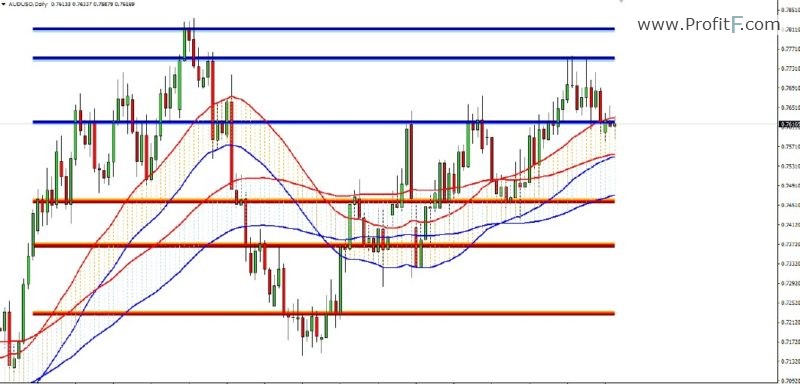
Now let’s take a look at the indicators we will use to identify Buy and Sell trades.
As with all trading systems, you need to get familiar with the individual components of the Cash Flow Channels system in order to identify Buy and Sell trade opportunities. It is important to understand how to interpret different scenarios you may encounter while trading the system. There are essentially two indicators that make up the Cash Flow Channels system. For the sake of simplicity, let’s call the first indicator CFC1 and the second indicator can be referred to as CFC2. Let’s take a look at the CFC1 indicator.
As you can see on the image below, the CFC1 indicator comprises of a series of horizontal lines which serve as Support and Resistance and highlight Buy and Sell action zones. The CFC1 indicator is used to determine whether price is in an area where we will consider entering Buy trades or Sell trades. The Dark Blue and Light Blue lines represent Sell action zones where we may consider entering Sell trades. The Orange and Maroon lines represent Buy action zones where we may consider entering Buy trades
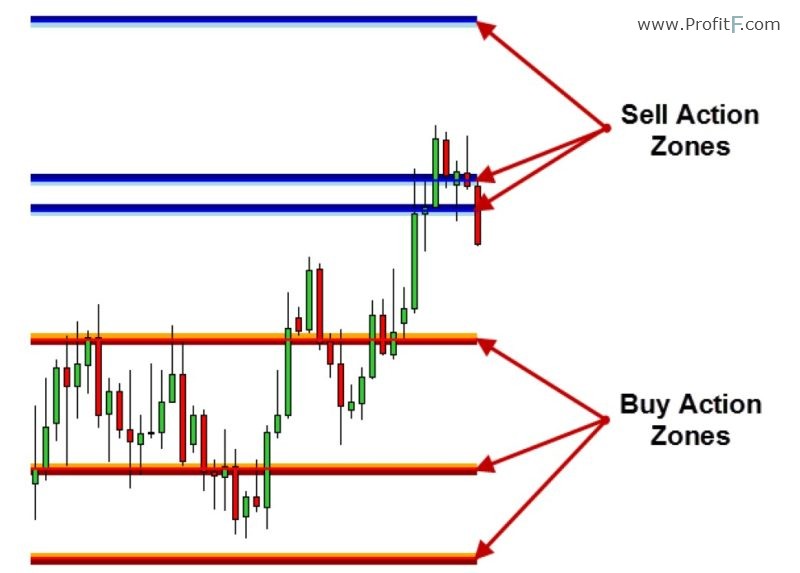
Each action zone on the CFC1 indicator shows two different colors.
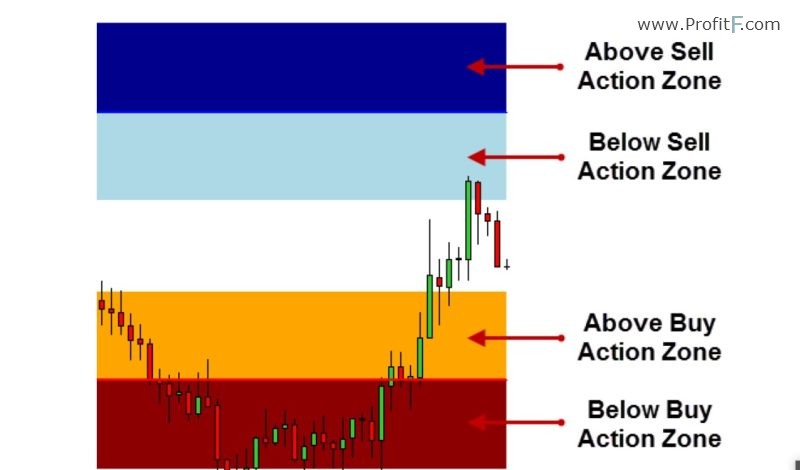
The Dark Blue lines highlight areas above the Sell action zone and the Light Blue lines highlight areas below the Sell action zones.
The Orange lines highlight areas above the Buy action zone and the Red lines highlight areas below the Buy action zones.
On the image below you can see these different colored levels clearly when the chart is switched to a lower timeframe.
The CFC1 indicator will help us determine the direction in which we will be trading.
When price is close to a Buy Action Zone we will only be looking to enter the market with Buy trades. On the other hand, if price near the vicinity of a Sell Action Zone we will only be looking to enter the market with Sell trades.
Of course, we do not rely on just the CFC1 indicator to identify trading opportunities. In order to ensure we take only the best trades, we will combine the information we gather from the CFC1 indicator with the CFC2 indicator.
On the following page, you will learn more about the CFC2 indicator.
The CFC2 indicator is used to ensure that we are trading with the trend. When observing this indicator we are essentially looking for a specific set of conditions to be met in order to identify trading opportunities.
On this image you can see the CFC2 indicator in position for Buy opportunities:
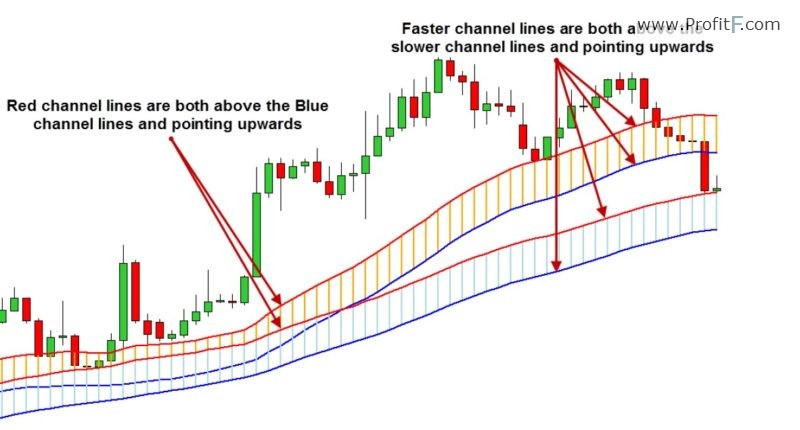
As you can see the CFC2 indicator is made up of 4 channel lines that form 2 sets of channels. In order for the indicator to signal Buy and Sell opportunities we want to see the lines fall into particular patterns.
As previously mentioned, on the image above you can see the patterns for Buy opportunities. On the right hand side of the image you can see that the faster channel lines are both above the slower channel lines and pointing upwards. When we observe this pattern, we will look to enter the market with Buy trades only.
While on the left hand side of the image you can see that both the Red channel lines are above both the Blue channel lines and pointing upwards. Once again, when we see this pattern, we will look to enter the market with Buy trades only.
Note that in both scenarios the lines must be pointing upwards in order for the pattern to be considered valid. We will be using this indicator on the Daily charts so at any given time we will usually be referring to the position of the lines in relation to a single candle.
On the following image you can see an example of a Sell pattern on the CFC2 indicator:
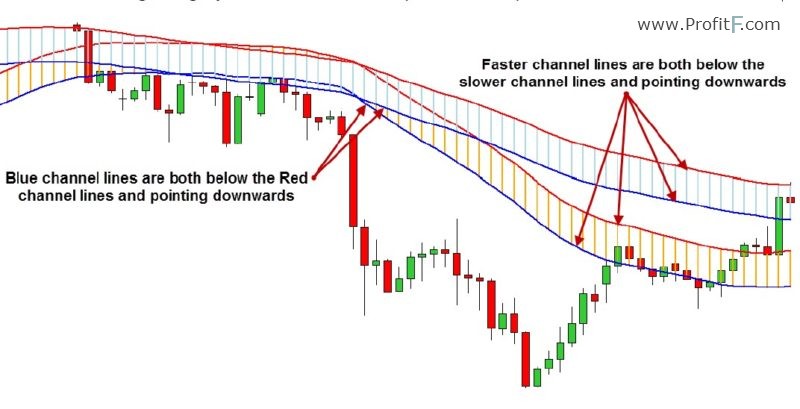
Once again you can see the CashFlowChannels 4 channel lines that form 2 sets of channels which make up the CFC2 indicator. Similar to the signals for Buy opportunities we want to see the lines fall into particular patterns to signal Sell opportunities.
On the right hand side of the image you can see that the faster channel lines are both below the slower channel lines and pointing downwards. When we observe this pattern, we will look to enter the market with Sell trades only. While on the left hand side of the image you can see that both the Blue channel lines are below both the Red channel lines and pointing downwards. Once again, when we see this pattern, we will look to enter the market with Sell trades only.
It is very important that in both scenarios all the lines must be pointing downwards in order for the pattern to be considered valid. If the lines are moving in a horizontal direction we may not consider the pattern to be valid. In cases like this we would be better served avoiding any trades until the lines start moving in a clear upward or downward direction.
Also remember that we will be using this indicator on the Daily charts so at any given time we will usually be referring to the position of the lines in relation to a single candle.
Before we move on to the Buy and Sell trade rules I would like to briefly cover the two techniques we will be using to enter the market once we’ve identified valid trade signals. While these are not actually indicators, trendline breakouts and step breakouts are components of the system that are used when entering trades.
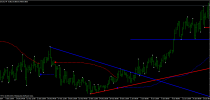
On the image below you can see examples of trendline breakouts:
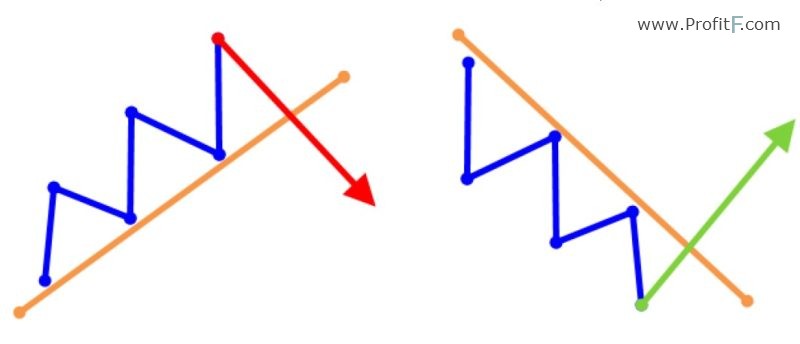
On the left hand side you can see a Bearish trendline breakout. As price (blue zig-zag line) moves upwards we draw a trendline across the lows (orange line). When price breaks below the trendline (red arrow) we may consider entering the market with a Sell trade. On the right hand side you can see a Bullish trendline breakout. As price (blue zig-zag line) moves downwards we draw a trendline across the highs (orange line). When price breaks above the trendline (green arrow) we may consider entering the market with a Buy trade.
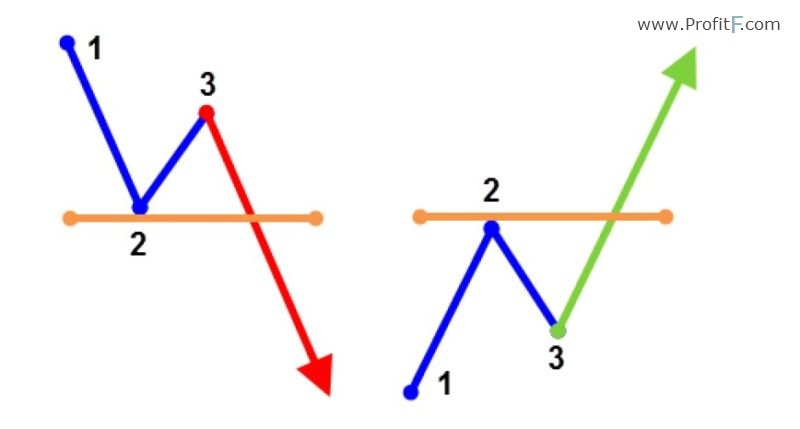
On the image above you can see Cash Flow Channels examples of step breakouts (aka 1-2-3 breakouts). On the left hand side you can see price (blue line) forms a 1-2-3 pattern then breaks out below Point 2 where we may consider entering the market with a Sell trade. On the right hand side you can see price (blue line) forms a 1-2-3 pattern then breaks out above Point 2 where we may consider entering the market with a Buy trade. Now that you’re familiar with the system components, let’s take a look at the Buy and Sell trade rules.
To trade this system profitably, all you need to do is follow the system rules at all times. If you encounter a scenario that does not match the rules do NOT enter a trade.
Let’s start with the rules for entering the market with Buy trades:
1. On the Daily chart price must be close to the Buy action zones on the CFC1 indicator.
2. On the CFC2 indicator the channel lines must be in position for a Buy trade. The faster channel lines must both be above the slower channel lines and pointing upwards. Alternatively, both the Red channel lines must be above both the Blue channel lines and pointing upwards.
3. Switch to the 4 Hour or 1 Hour chart and confirm that price is near the Buy action zones on the CFC1 indicator and the CFC2 indicator is in position for a Buy trade. This means that the faster channel lines must both be above the slower channel lines and pointing upwards. Alternatively, both the Red channel lines must be above both the Blue channel lines and pointing upwards.
4. Enter the market with a Buy trade using a market order when price breaks above a trendline or a 1-2-3 step pattern.
5. Set your Stop Loss a few pips below the most recent low.
6. Set your Take Profit twice the distance away from the entry level as your Stop Loss or greater, i.e. a minimum of 1:2 Risk/Reward Ratio or greater. Alternatively you may exit the trade when price reaches a Sell action zone.
7. Optionally, when price reaches half the distance to your Take Profit level, move your Stop Loss to breakeven.
See an example of a Buy trade as per the rules of the Cash Flow Channels trading system.
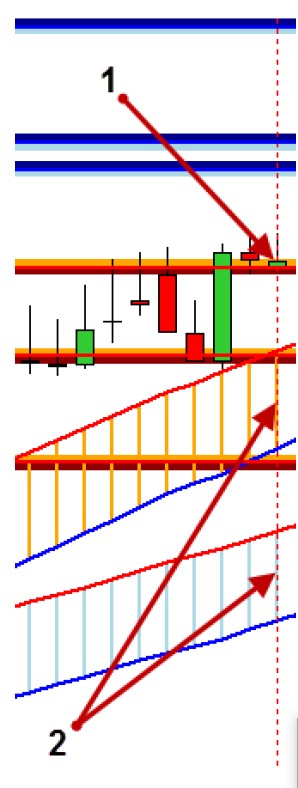
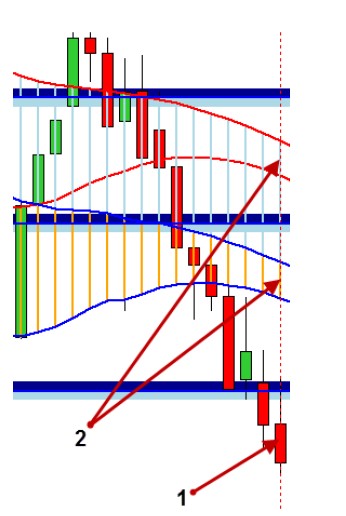
At Point 1 price is close to the Buy action zones on the CFC1 indicator. At Point 2 the CFC2 MetaTrader indicator channel lines are in position for a Buy trade. The faster channel lines are both above the slower channel lines and pointing upwards.
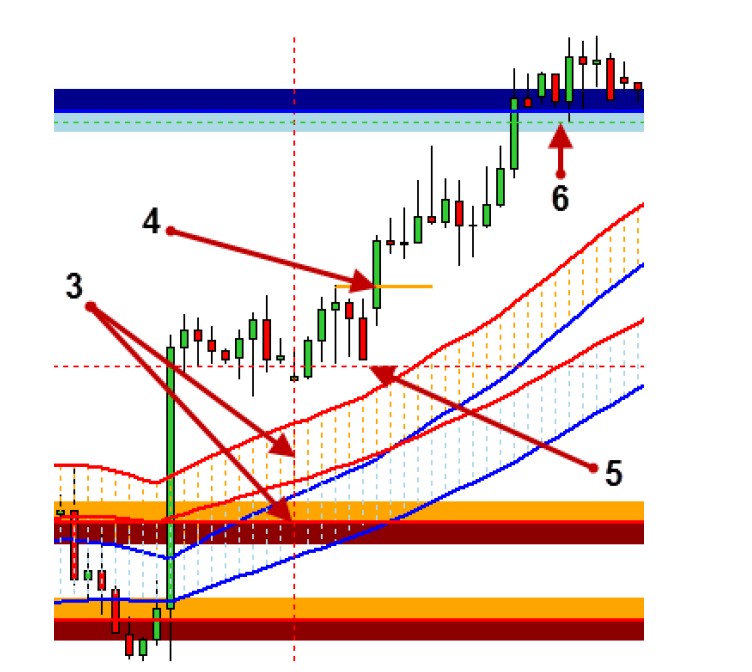
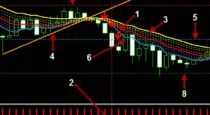
On the image below we switched to the 4 Hour chart and confirm at Point 3 that price is near the Buy action zones on the CFC1 indicator and the CFC2 indicator is in position for a Buy trade. At Point 4 we enter the market with a Buy trade using a market order when price breaks above a 1-2-3 step pattern. At Point 5 we set our Stop Loss a few pips below the most recent low. At Point 6 we set our Take Profit twice the distance away from the entry level as our Stop Loss, i.e. a minimum of 1:2 Risk/Reward Ratio. In this example our Stop Loss was at the Sell action zone where we could have exited the trade manually so we were taken out of the trade in profit. Remember that we can move our Stop Loss to breakeven when price reaches 50% of the distance to our Take Profit.
It’s as simple as that! Now that you are familiar with the rules for entering Buy trades, let’s take a closer look at the rules for identifying and entering Sell trades.
You’ll notice that the rules for entering Sell trades are the opposite of Buy trades. Let’s take a closer look:
1. On the Daily chart price must be close to the Sell action zones on the CFC1 indicator.
2. On the CFC2 indicator the channel lines must be in position for a Sell trade. The faster channel lines must both be below the slower channel lines and pointing downwards. Alternatively, both the Blue channel lines must be below both the Red channel lines and pointing downwards.
3. Switch to the 4 Hour or 1 Hour chart and confirm that price is near the Sell action zones on the CFC1 indicator and the CFC2 indicator is in position for a Sell trade. This means that the faster channel lines must both be below the slower channel lines and pointing downwards. Alternatively, both the Blue channel lines must be below both the Red channel lines and pointing downwards.
4. Enter the market with a Sell trade using a market order when price breaks below a trendline or a 1-2-3 step pattern.
5. Set your Stop Loss a few pips above the most recent high.
6. Set your Take Profit twice the distance away from the entry level as your Stop Loss or greater, i.e. a minimum of 1:2 Risk/Reward Ratio or greater. Alternatively you may exit the trade when price reaches a Buy action zone.
7. Optionally, when price reaches half the distance to your Take Profit level, move your Stop Loss to breakeven.
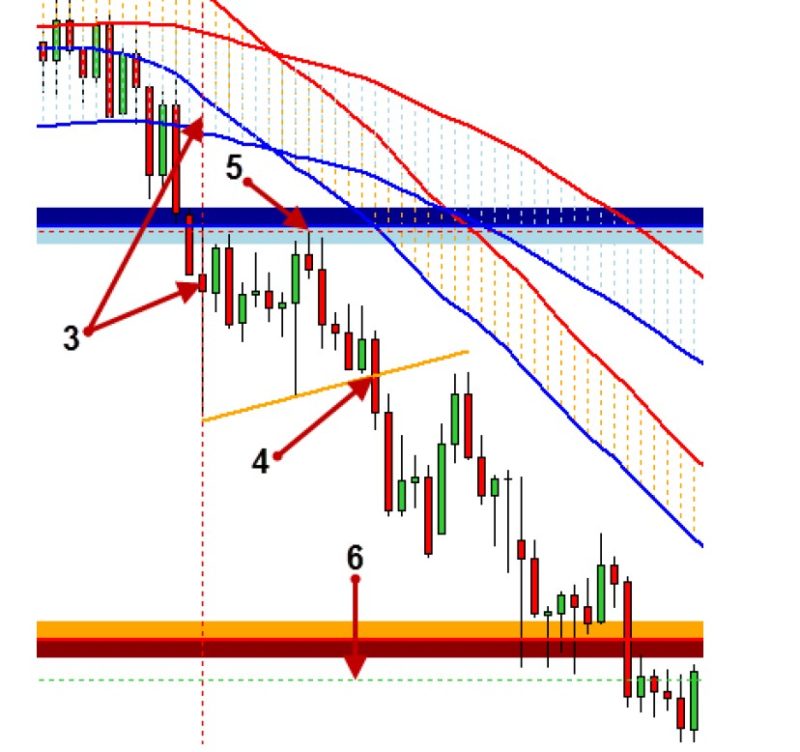
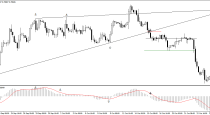
See an example of a Sell trade as per the rules of the Cash Flow Channels trading system.
If you are still new to trading I recommend that you start trading Cash Flow Channels on a demo account until you have mastered it. Spend as much time as you can practicing! Take the time to learn how to identify valid trade setups on your charts and you will soon start to see them everywhere. DO NOT over-trade. This system is designed to highlight only the very best trades so be patient. When the right conditions come along, don’t hesitate to pull the trigger.
If you find trades with huge Stop Losses, avoid them and wait for the next trade signal. Always stick to the rules! The best traders in the world are not the most creative people but the ones that have the most discipline and can follow their strategies without veering off course.
Trade ONLY crystal clear signals. If you ever have any doubts about a trade signal it is best to skip the trade and wait for the next one. Taking more trades and being more active will only lead to more risk. Aim to take fewer trades and only the best ones.

 (6 votes, average: 4.17 out of 5)
Quick question
For a buy trade, must CFC1 Indicator be below CFC2 indicator to be a valid rule 1 and 2? For a sell trade, must CFC2 indicator be above CFC1 indicator to count as a valid rule 1 and 2?