
Head and Shoulders reversal pattern. Of the many chart patterns available, none can compare to the popularity of the Head and Shoulders chart pattern. It is typically associated with the start of a new trend and therefore when a Head and Shoulders pattern is formed at the top, it signifies the start of a down trend on the time frame it appears and an inverted head and shoulders pattern is formed towards the bottom of a down trend and indicates the start of an uptrend.
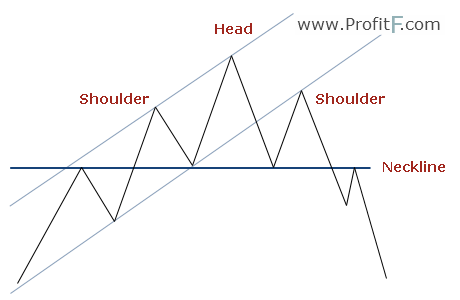
The head and shoulders pattern is identified with three peaks with the middle peak standing out from the other two. Ideally, the Head and Shoulders is more suitable and validated in the stock markets because of volume, however the head and shoulders can also be traded in the forex markets as well.
What causes the Head and Shoulders pattern to form?
The Head and Shoulders Pattern basically hints towards exhaustion and the final market moves before a new opposite trend starts. This is identified by price making a new high followed by establishing a support level. A second attempt is made to push prices higher resulting in a second higher high. Usually, volume starts to decline from the start of the second peak resulting in a third attempt to make a high on continuously declining volume with a lower high being made, all the while price staying well above the support level, known as the neckline.
The charts below shows typical example of a head and shoulders as well as the inverted head and shoulders pattern including how they are traded.
In figures 1 and 2, we have the classic head and shoulders and the inverted head and shoulders pattern with a horizontal support line, or neck line. The head and shoulders pattern is traded when there is a break of the neckline and a short position is entered on the pullback. Stops are placed at previous intermediary highs, while the target is a projected distance of the previous head and neckline price distance.
The head and shoulders pattern can be formed with slating necklines as well. It is better identified based on declining volumes from the second (head) and third peak onwards.
Note that sometimes price tend to break out of the neckline and continues towards the price objective with no pullbacks to the neckline. Therefore, instead of placing a pending order expecting a pullback to the neckline a better approach is to initiate a small position on the neckline, which can capture the move in the event of no pullbacks.

Figure 1: Head and Shoulders Pattern Example

Figure 2: Inverted Head and Shoulders pattern
To correctly identify the head and shoulders pattern it is best advised to make use of the line chart as the closing prices are more valid than highs and also the patterns are easy to identify. In figure 3, we have an example of an inverted head and shoulders pattern.
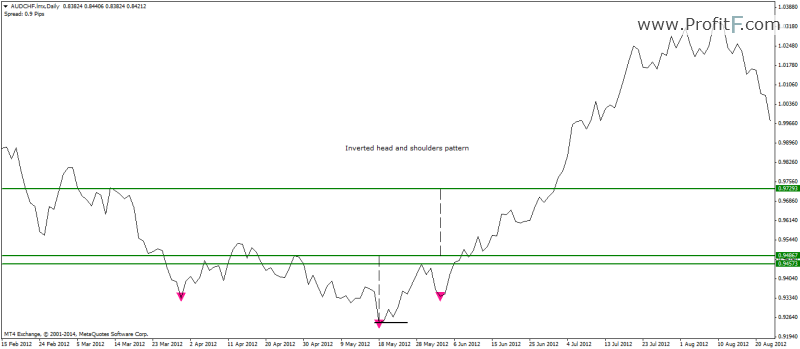
Figure 3: Inverted head and shoulders pattern
In the above chart, we notice from the left of the chart, that price was in a down trend. Soon, it establishes resistance level and drops lower only to rally back up to test the resistance. On successful test of the resistance, price drops back to make a lower low, forming the head and eventually makes the right shoulder.
After this, price breaks the neckline resistance and starts to rally. In terms of the projected price, it is the measured distance from the head to the neckline, projected upwards from the break of the neckline. As can be seen from the chart, price continues on to rally making new highs.
In Figure 4, we have an example of a head and shoulders pattern. Here, we can see that the pattern was of a much smaller scale, but it was validated, with price breaking the neckline and reaching its minimum target.

Figure 4: Head and Shoulders Pattern example
From the above two examples of head and shoulders as well as the inverted head and shoulders price patterns; we can see that this is a highly reliable pattern, especially when analyzed with line charts. Because closing prices are considered more valuable than the highs and lows price rejection, trading the head and shoulders top and bottom patterns are not only easier to spot but a lot more valid, removing a lot of subjectivity from spotting them.
When trading the head and shoulders pattern, traders should bear in mind that there are instances where the head and shoulders pattern can also act as a continuation pattern. For example, it is not common to see an inverted head and shoulders pattern being formed within an uptrend, which indicates higher price movements and likewise, the appearance of the head and shoulders pattern within a down trend is indicative of a continued move to the downside. These continuation patterns though are a lot rare compared to the classic patterns that we usually get to see.
Head and Shoulders Pattern – Educational Video:

 (6 votes, average: 4.33 out of 5)
It’s your take profit target. Where you place the take profit order to close trade with gains.


Can u please explain what is meant by the projected target and its significance? Thanks.