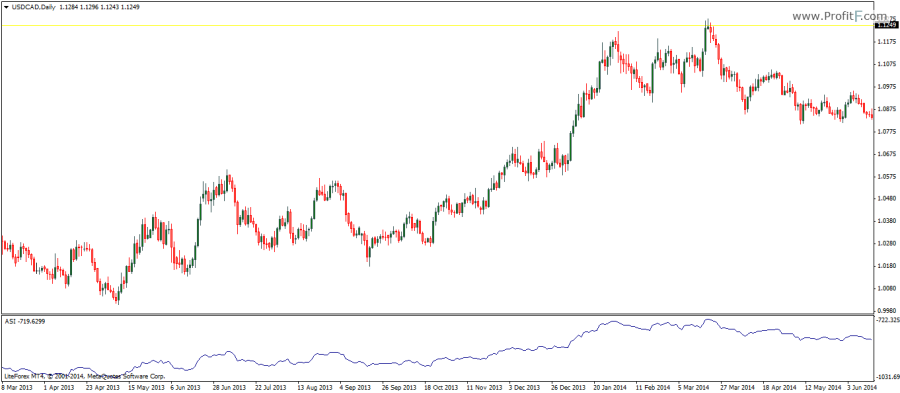
Accumulation Swing index indicator (ASI) is yet another discovery by Welles Wilder. The indicator is primarily used for trading divergences and is used as a confirmation. The indicator is also used to gauge the long term trend of the security.
The ASI is nothing but a running total of the Swing Index, which measures the short term price action. The Swing index is also a discovery by Welles Wilder which was later on improved to the ASI as we know of today as the Swing index was considered to have some flaws in determining the trend strength. The Swing index (and the ASI) is used for determining trend strength and market direction.

Besides serving the purpose of confirming divergences, the ASI is also commonly cited to be used for confirming break outs with the ability to plot trend lines on the ASI indicator along with the trend lines on the price charts. A break out of the ASI trend line is a sure confirmation of a break out in prices from the trend line. The ASI indicator comes with no default settings although customized versions of the ASI indicator allows traders to change the look back period to anything of their choice.
Accumulation Swing index indicator Formula:
- SI(i) = 50*(CLOSE(i-1) – CLOSE(i) + 0,5*(CLOSE(i-1) – OPEN(i-1)) + 0,25*(CLOSE(i) – OPEN(i)) / R)*(K / T)
ASI(i) = SI(i-1) + SI(i)
Where:
SI (i) — current value of Swing Index technical indicator;
SI (i – 1) — stands for the value of Swing Index on the previous bar;
CLOSE (i) — current close price;
CLOSE (i – 1) — previous close price;
OPEN (i) — current open price;
OPEN (i – 1) — previous open price;
R — the parameter we get from a complicated formula based on the ratio between current close price and previous maximum and minimum;
K — the greatest of two values: (HIGH (i – 1) – CLOSE (i)) and (LOW (i – 1) – CLOSE (i));
T — the maximum price changing during trade session;
ASI (i) — the current value of Accumulation Swing Index.
Download Accumulation Swing index indicator
Add your review