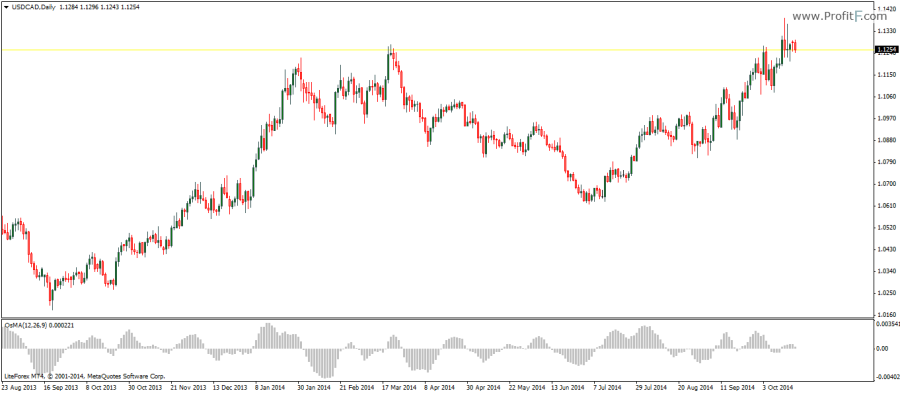
OsMA indicator (Moving average of oscillator) – the moving average of oscillator measures and plots the difference between the oscillator and the oscillator’s smoothing. It is based on the MACD oscillator and therefore in effect measures the difference between the MACD and the signal line.

The moving average of oscillator is not to be confused for moving average oscillator which works in a different set of principles and is calculated differently. The OsMA indicator determines the relationship between trend and the price, signaling overbought or oversold conditions in the market.
The OsMA has some distinctive signal triggers. When the OsMA switches from declining to rising histogram, it alerts traders to a rising bullish trend and similarly when the OsMA switches from rising to declining histogram, it indicates a change to a bearish trend. Other signals also include buying when the OsMA moves above the 0-line and selling when the OsMA declines below the 0-line. It is also possible to detect divergences in relation to price highs and low comparing to the OsMA’s histogram highs and lows.