
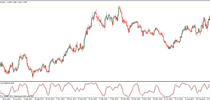
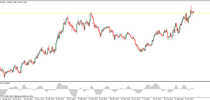
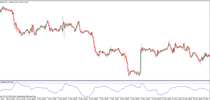
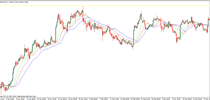
The Parabolic SAR indicator used to identify market trends. The SAR stands for Stop and Reverse. The indicator is plotted on the price chart and is somewhat similar to the moving average, except that the Parabolic SAR is plotted as dots whereas the moving average is represented as line. The indicator was developed by Welles Wilder.
The Parabolic SAR comes with default settings of Step and Maximum of 0.02 and 0.2. It follows a rather complex calculation but the most important factor to note is the acceleration or the maximum. The PSAR’s sensitivity can be changed by modifying the acceleration or the maximum value.
The PSAR indicator is commonly used to identify entry as well as trailing stop levels that can be set once a trade is already entered. It is also an especially useful indicator when combined with the moving average as the PSAR can indicator short term corrections in price while price is in an uptrend (or a downtrend) depending on how price is trading in relation to the moving average.

Parabolic SAR should therefore be used only in trending markets as it is prone to produce fake signals during ranging or flat markets. In trending markets, a potential reversal or counter trend trade is usually taken at the latest value of the PSAR. When price hits the PSAR, it often indicates a short term change in trend.
Download The Parabolic SAR indicator
 (No Ratings Yet)
Add your review