
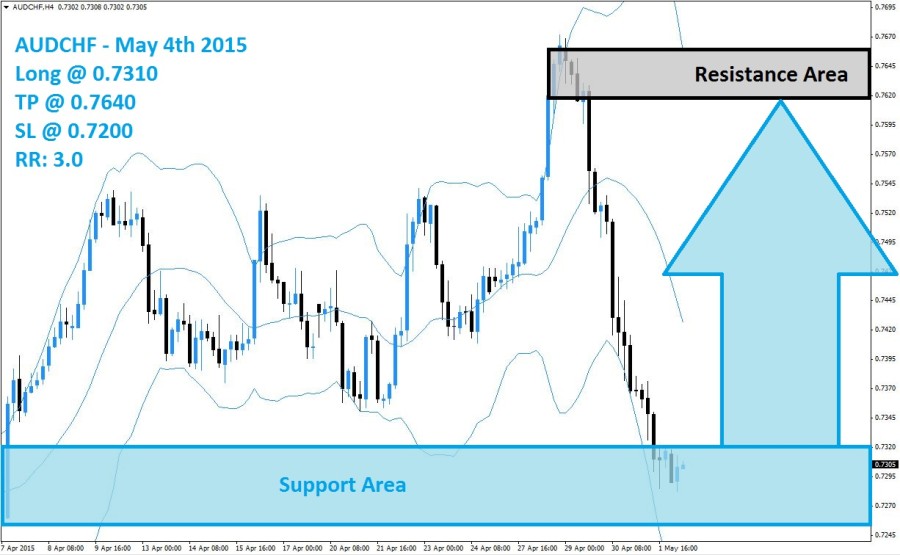
The AUDCHF was exposed to a sharp sell-off which plunged this currency pair from its resistance area, visible in light grey in the above H4 chart, down to its support area which is visible in light blue. Preceding this extreme sell-off was the breakout of the upper Bollinger Band above its resistance area; a move which was not confirmed by price action. Economic data provided the fuel required to increase a round of profit taking as forex traders realized floating trading profits.
The upper Bollinger Band has started to reverse its advance and is now trading inside of its resistance area. A breakdown below the advancing middle band of the Bollinger Band has further accelerated the sell-off and forced the middle Bollinger Band to change direction. Now the AUDCHF is trading at its support area and price action has stopped its massive move to the downside. Forex traders are likely to once again take profits and close their short positons in order to realize floating trading profits.
Forex traders are advised to seek out e long positions at 0.7310 and below as the current sell-off is poised to change momentum; conservative traders may wish to wait for the middle band of the Bollinger Band to approach the support are. A take profit target of 0.7640 is recommended for a potential trading profit of 330 pips on the H4 Chart. A breakout above the middle Bollinger Band is expected to take the AUDCHF to the upside.
Forex traders should protect this trade with a stop loss level at 0.7200 for a potential trading loss of 110 pips which will result in a Risk-Reward (RR) ratio of 3.00.
AUDCHF
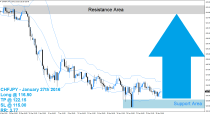
Long @ 0.7310
TP @ 0.7640
SL @ 0.7200
RR: 3.00
 (No Ratings Yet)
Add your review