
AUSUSD trading plan.
Buy pullbacks between 0,72 and 0,725. Watch the resistances around 0,735 and 076 for possible selling signals and the resuming of a long term bearish trend.
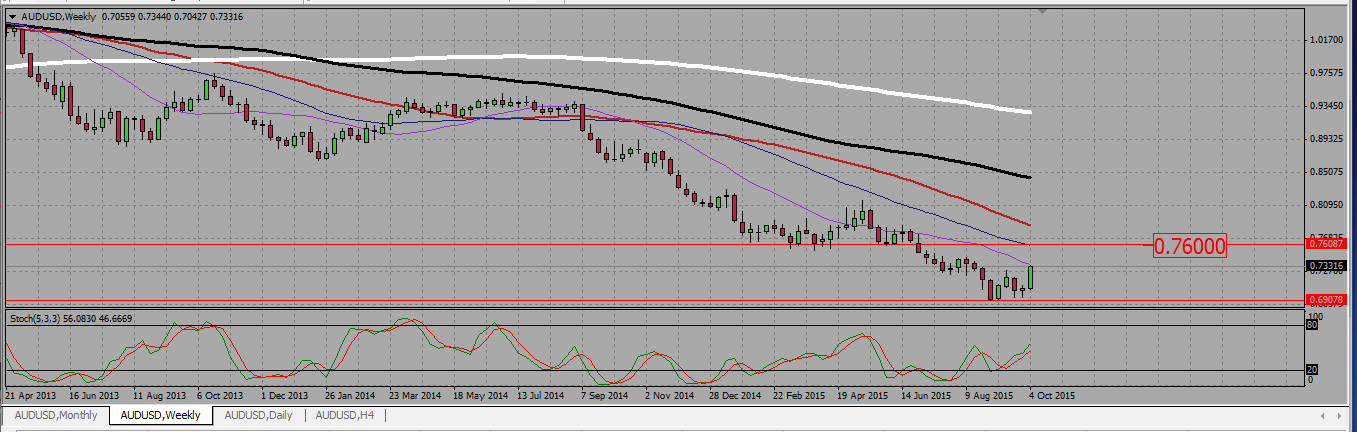
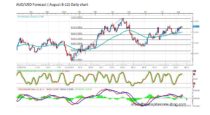
On the weekly chart, we see AUDUSD was in a down trend, but then the pair rejected a support around 0,69, and went up by 400 pips. It is now trading above 0,73. There is an obvious resistance level around 0,76.
AUDUSD WEEKLY CHART.
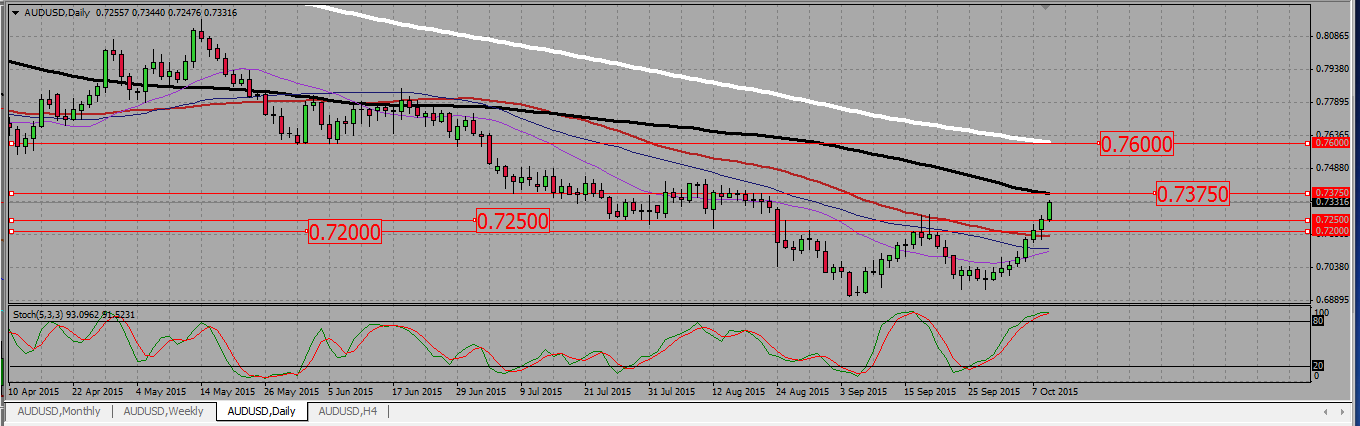
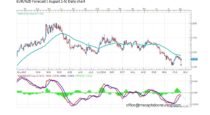
On the daily chart, the pair broke up a resistance area between 0,72 and 0,75. This zone is now a support, and a bearish breaking of it will end my bullish bias. I will buy signals there, paying attention to two resistances : one is around 0,735, the other around 0,76. As the long term trend is still rather bearish, I will be ready to close any long trade I may have and to sell a signal in those areas.
AUDUSD DAILY CHART.
CADJPY trading plan.
Buy signals on a retest of a daily range resistance around 92.
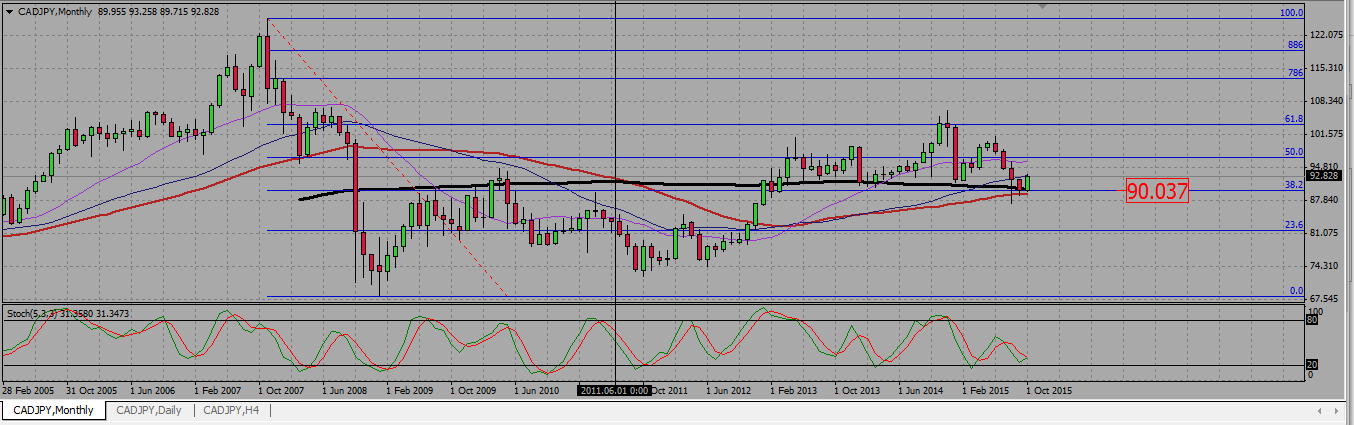
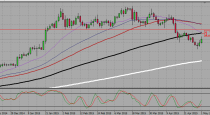
On the monthly chart, the pair is rather ranging, bit it may be rejecting a support around 90, where a fibo line and the 100 SMA are located.
CADJPY MONTHLY CHART.
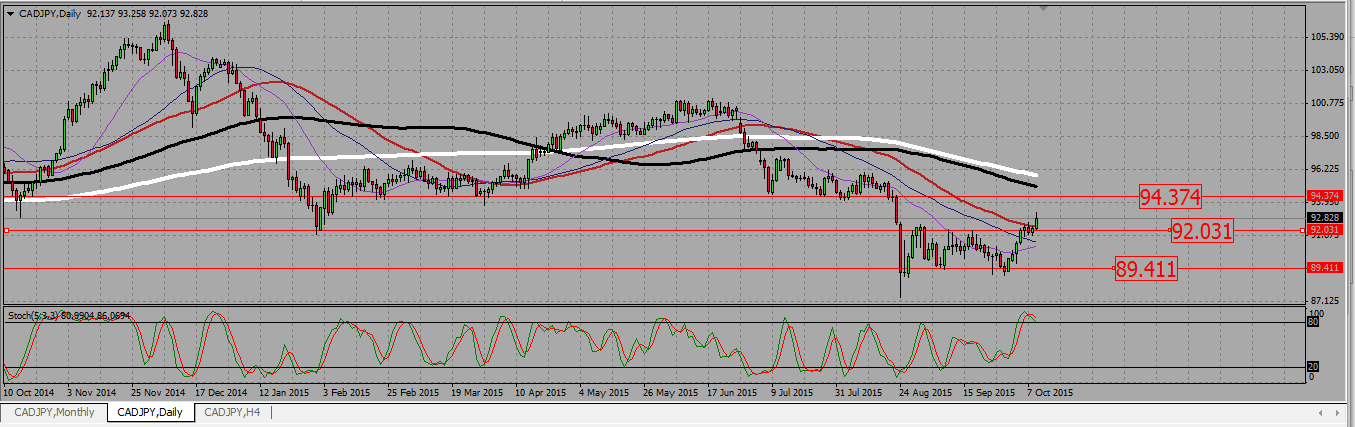
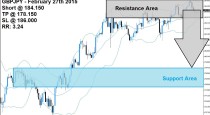
On the daily, the pair was trading within a range from 89,5 to 92. It broke that range resistance, altogether with the daily 55 SMA this week. I will look to buy any retest of that zone towards a resistance near 94.
CADJPY DAILY CHART.
 (No Ratings Yet)
Add your review