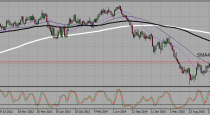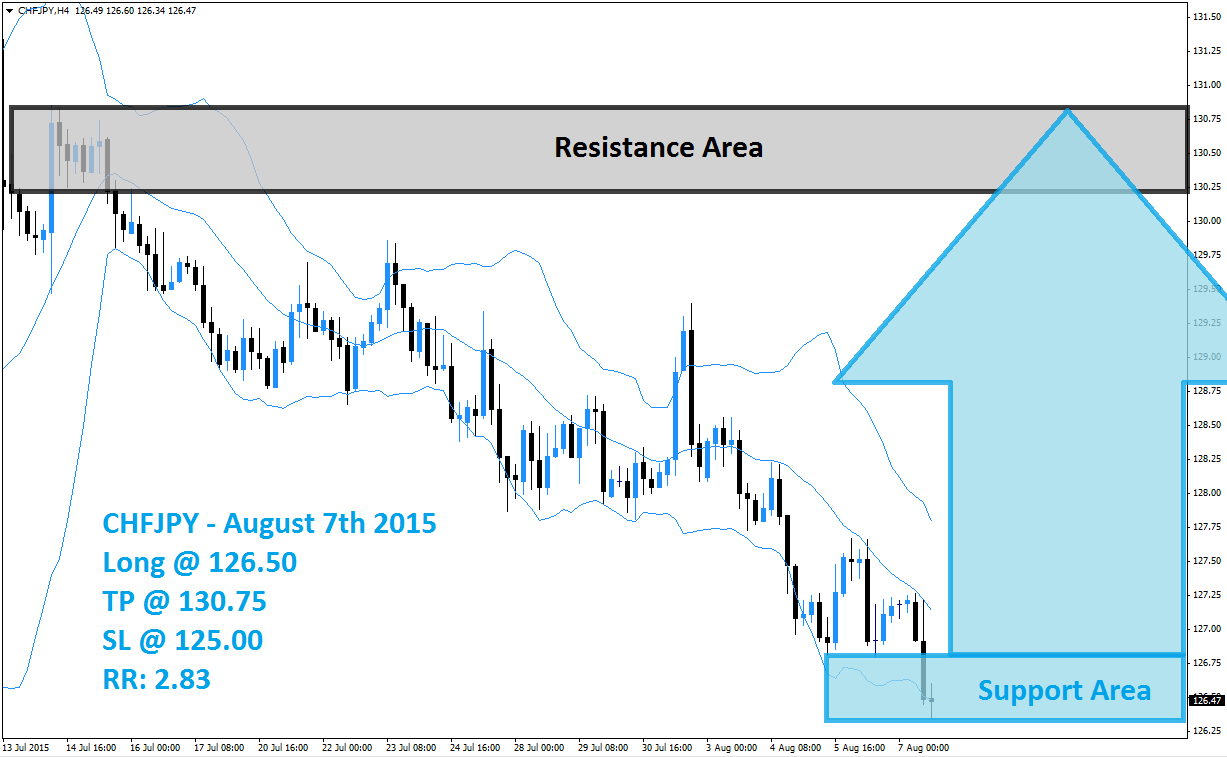
The CHFJPY has sold-off after failing to breakout above its resistance area which is marked in light grey in the above H4 chart. The Bollinger Band indicator has support the sell-off and kept price action contained. The latest H4 candlestick indicates a potential end to the sell-off and has formed at the bottom of its support area which is visible in light blue. The lower band of the Bollinger Band indicator is trading inside of its support area.
This currency pair is trading between the middle band and the lower band of its Bollinger Band indicator; a breakout above the middle band is likely to ignite a short-covering rally as forex traders will realize floating trading profits by closing their short positions. A further breakout above it supper band could swing momentum for good and allow the CHFJPY to extend its rally back into its resistance area from where a new breakout attempt cold follow
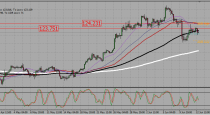
Forex traders are advised to seek long entry positions at 126.50 and below which will position their trading accounts to profit from the expected short-covering rally. Conservative forex traders should wait for a breakout above the middle band of it Bollinger Band indicator before entering their long positions. A take profit target of 130.75 has been set for a potential trading profit of 425 pips on the H4 Chart. More buy orders are expected after this currency pair completes its breakout above the middle Bollinger Band.
Forex traders should protect this trade with a stop loss level at 125.00 for a potential trading loss of 150 pips which will result in a Risk-Reward (RR) ratio of 2.83.
CHFJPY
Long @ 126.50
TP @ 130.75
SL @ 125.00
RR: 2.83
 (No Ratings Yet)