
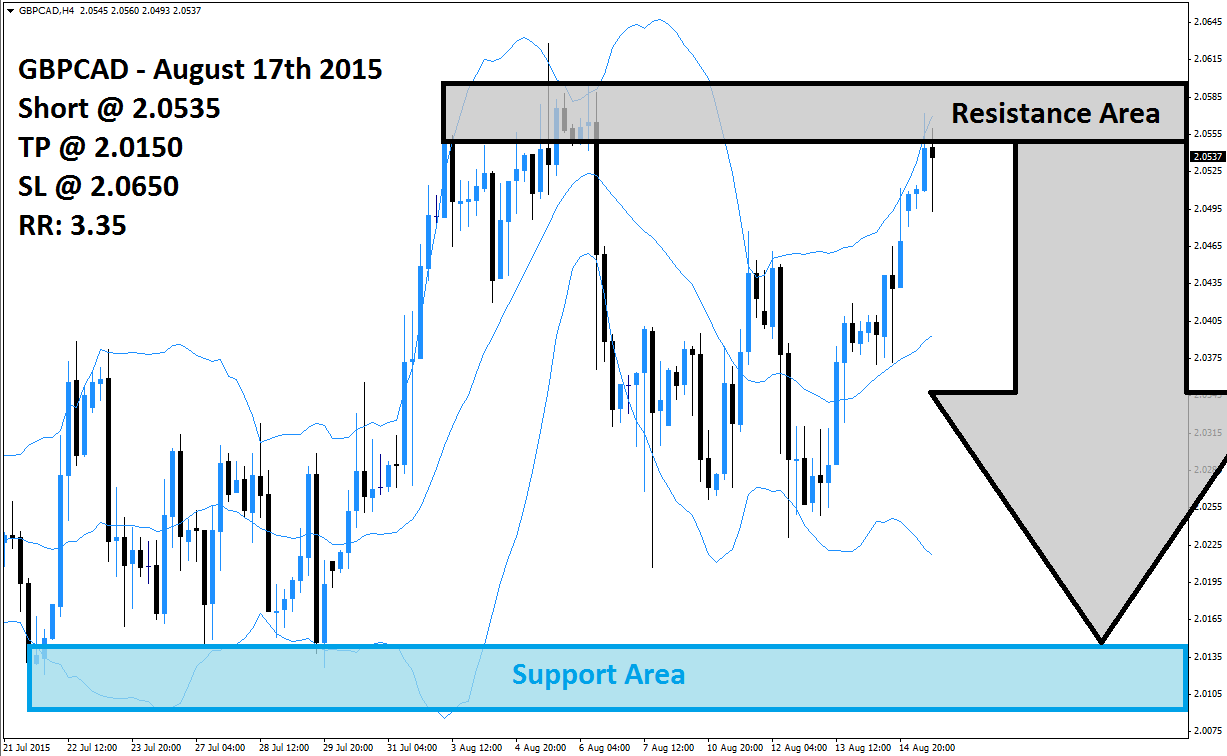
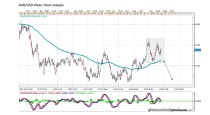
The GBPCAD has rallied from its lower Bollinger Band back into its resistance area which is visible in light grey in the above H4 chart. This is the second attempt of this currency pair to breakout in order to record new highs, but forex traders should be prepared for another failed breakout and price action reversal. The upper Bollinger band has now reached its resistance area and is sloping higher as is the middle band while the lower band is sloping to the downside.
Forex trader may decide to lock in floating trading profits and close their long positions which could lead to a profit taking sell-off. The GBPCAD is currently trading between the upper band and the middle band of its Bollinger Band indicator, but a breakdown below the middle band is likely to accelerate the expected sell-off in this currency pair. The GBPCAD is expected to drop back into its support area which is marked in light blue in the above chart.
Forex traders are recommended to seek short positions at 2.0535 and above in order to profit from the expected profit taking sell-off in this currency pair. Conservative forex traders should wait for price action to break down below the middle band of its Bollinger Band Indicator which will increase selling pressure. A take profit target of 2.0150 has been selected for a potential trading profit of 385 pips. More sell-order are expected below the middle band of the Bollinger Band indicator.
Forex traders should protect this trade with a stop loss level at 2.0650 for a potential trading loss of 115 pips which will result in a Risk-Reward (RR) ratio of 3.35.
GBPCAD
Short @ 2.0535
TP @ 2.0150
SL @ 2.0650
RR: 3.35
 (No Ratings Yet)
Add your review