
The US dollar showed its strength last Thursday and last Friday, and that offers us very good setups for the coming week.
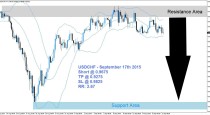
1-EU trading plan.
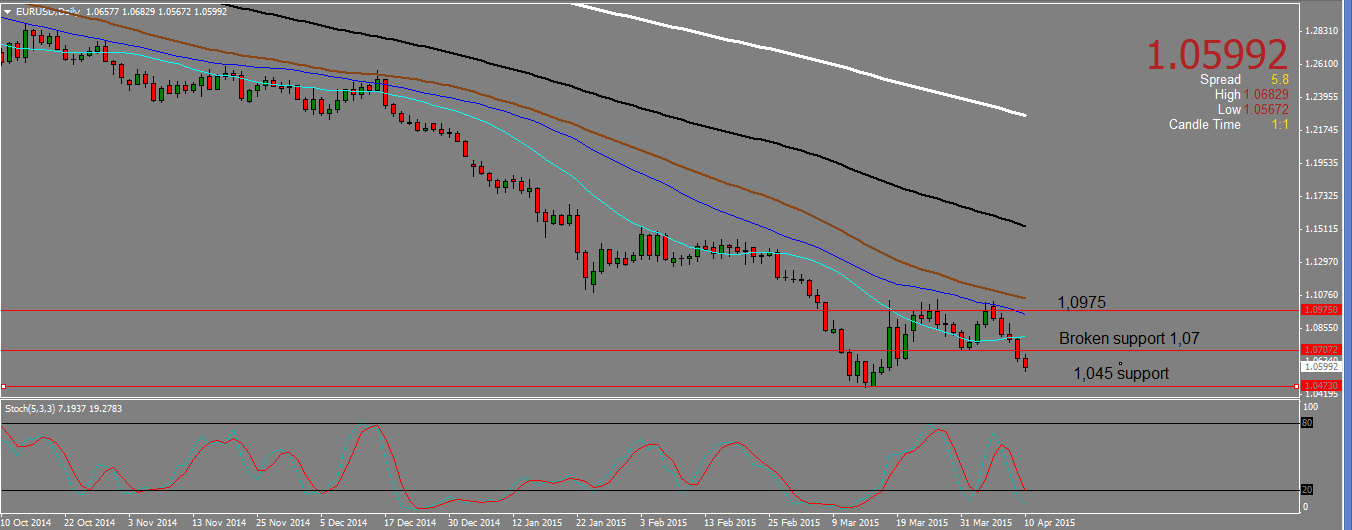
Sell signals under 1,07 towards 1,05 and 0,915. Mind last low (1,045) and parity.
The daily chart shows us a sharp bearish move with a breaking down of a support around 1,07. That support is now resistance and we will be looking to sell rallies under it. On our way down we will be careful around 1,045 support and be ready to close the trade should there be a bullish reversal pattern at that level.
EU DAILY CHART.
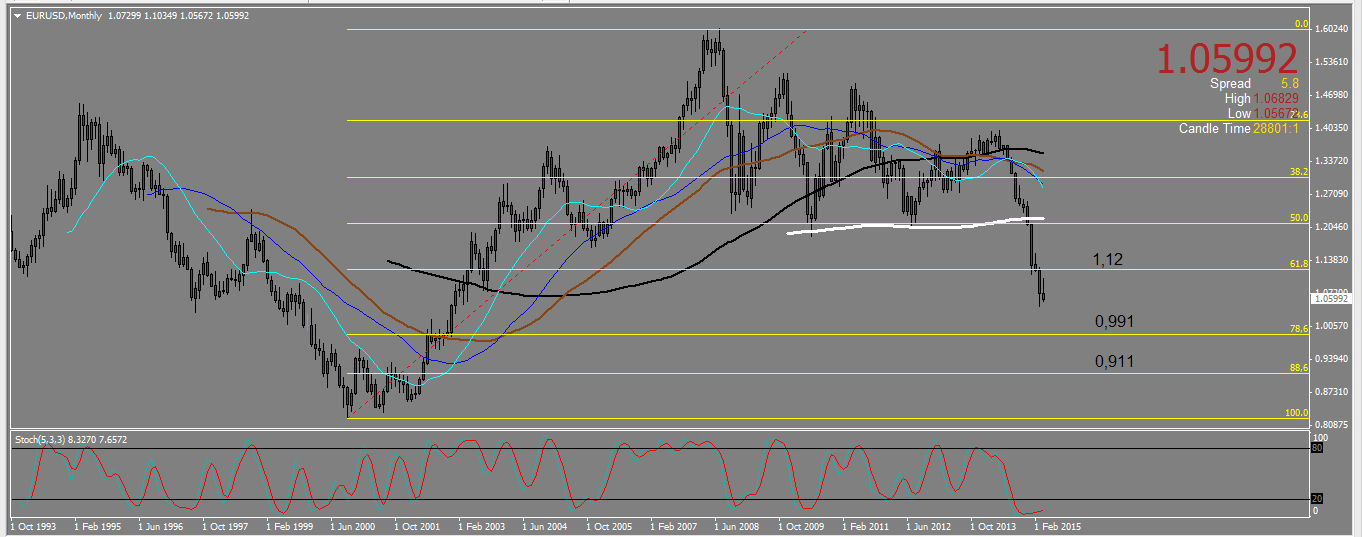
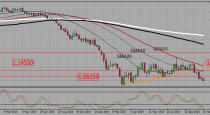
We will deduct the take profit levels from the monthly chart. It shows we broke a 61,8 fib resistance around 1,1. In that case we are probably heading for the next fib lines, that is the ,786 at 0,991 and the ,886 at 0,911. We propose to set up our take profit levels slightly above them, at 1,05 and 0,915. Needless to say, the parity and those two fib lines will also be levels to watch for a bullish reversal.
EU MONTHLY CHART.
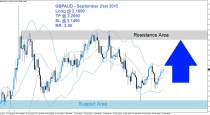
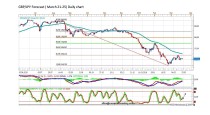
2-GU trading plan.
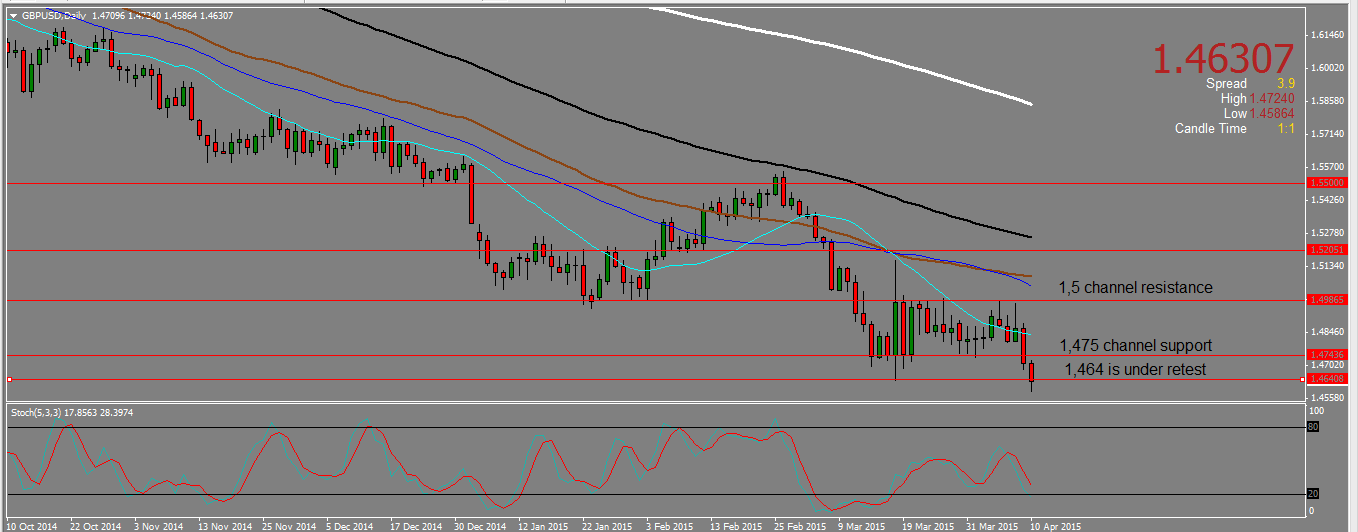
Sell rallies under 1,475 towards 1,4225. Allow for a real pull back and a clear bearish signal to avoid getting trapped in a possible bullish reversal around 1,464.
On the daily chart the pair broke down a channel (1,5 -1,475) that was holding it for two weeks. This means GU is probably going down, but it still has to clear a last support around 1,464.
GU DAILY CHART.
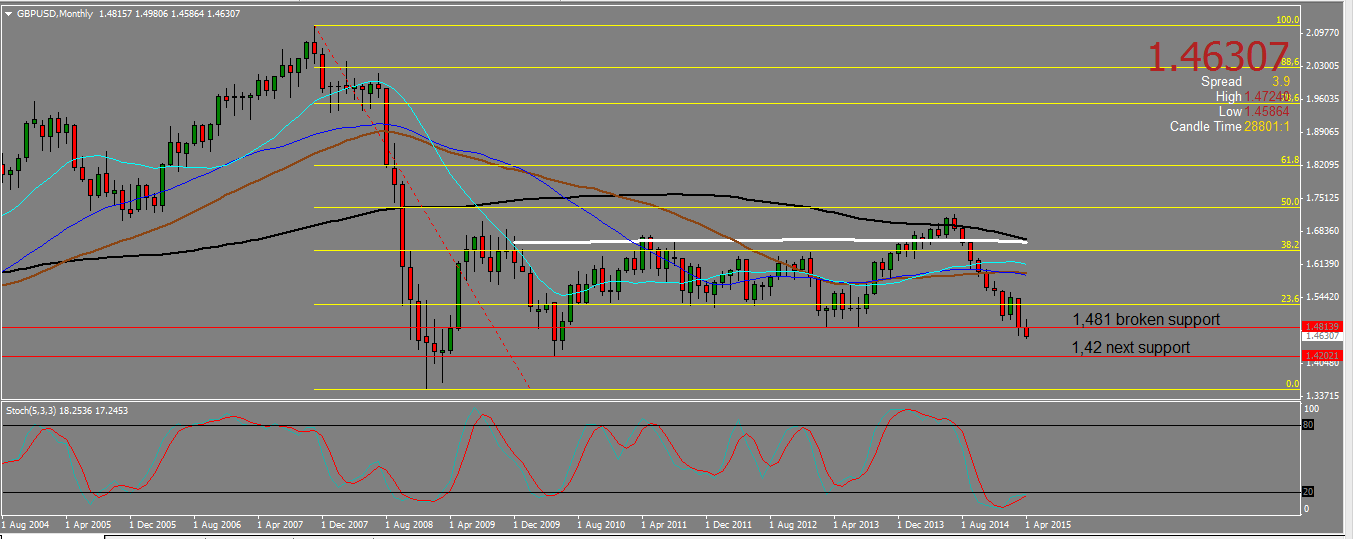
Here again, the monthly chart will give us a take profit level. We broke 1,48 support line and the next support is at 1,42. We propose to set up our take profit level at 1,4225.
GU MONTHLY CHART.
3-UJ TRADING PLAN.
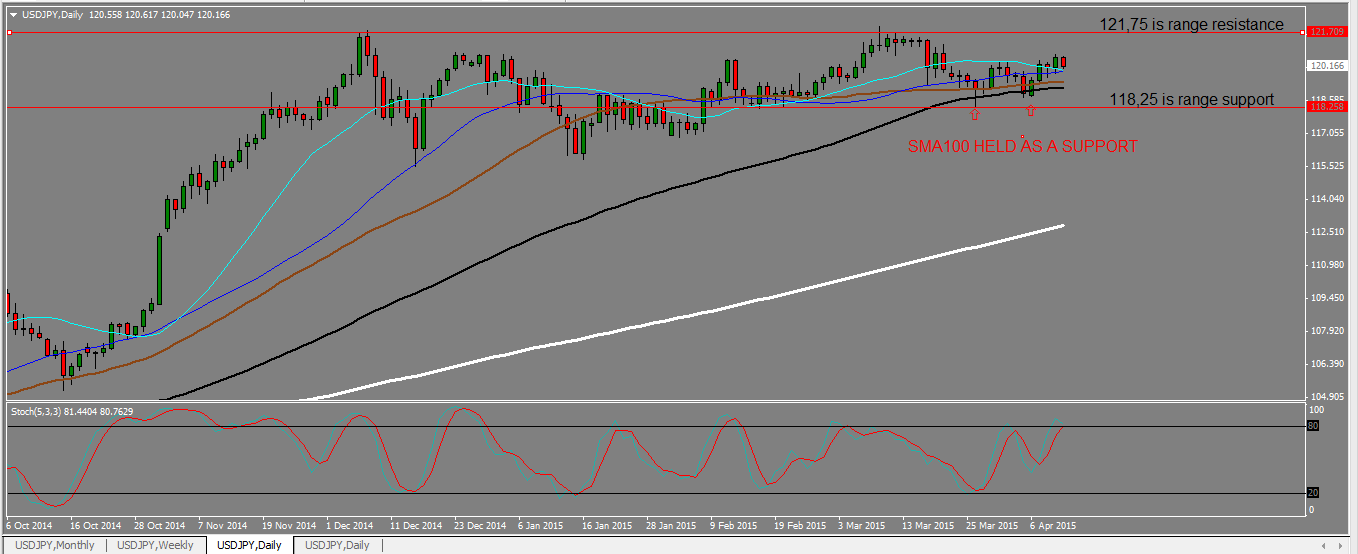
In a range 121,75 118,25. Trade the range (*), but also buy dips above 119 towards 121,75.
On the daily chat, UJ is ranging between 121,75 and 118,25. The last candle is a dark cloud cover which means we may expect some bearish action on the beginning of next week. The SMA100 around 119 is however a support that held on last retest.
UJ DAILY CHART.
Finally H4 shows what may be the beginning of an uptrend (higher highs and higher lows), and this is why we have a bullish bias on that pair. Please note the SMA confluence at 119,75 which may offer a support to bounce from.
(*) How to trade a daily range.
Enter on H4 reversal signals from one side of the range to the other. On a break outside of the range, wait for a pull back and a confirmation candle before entering, also on H4.
 (No Ratings Yet)
Add your review