
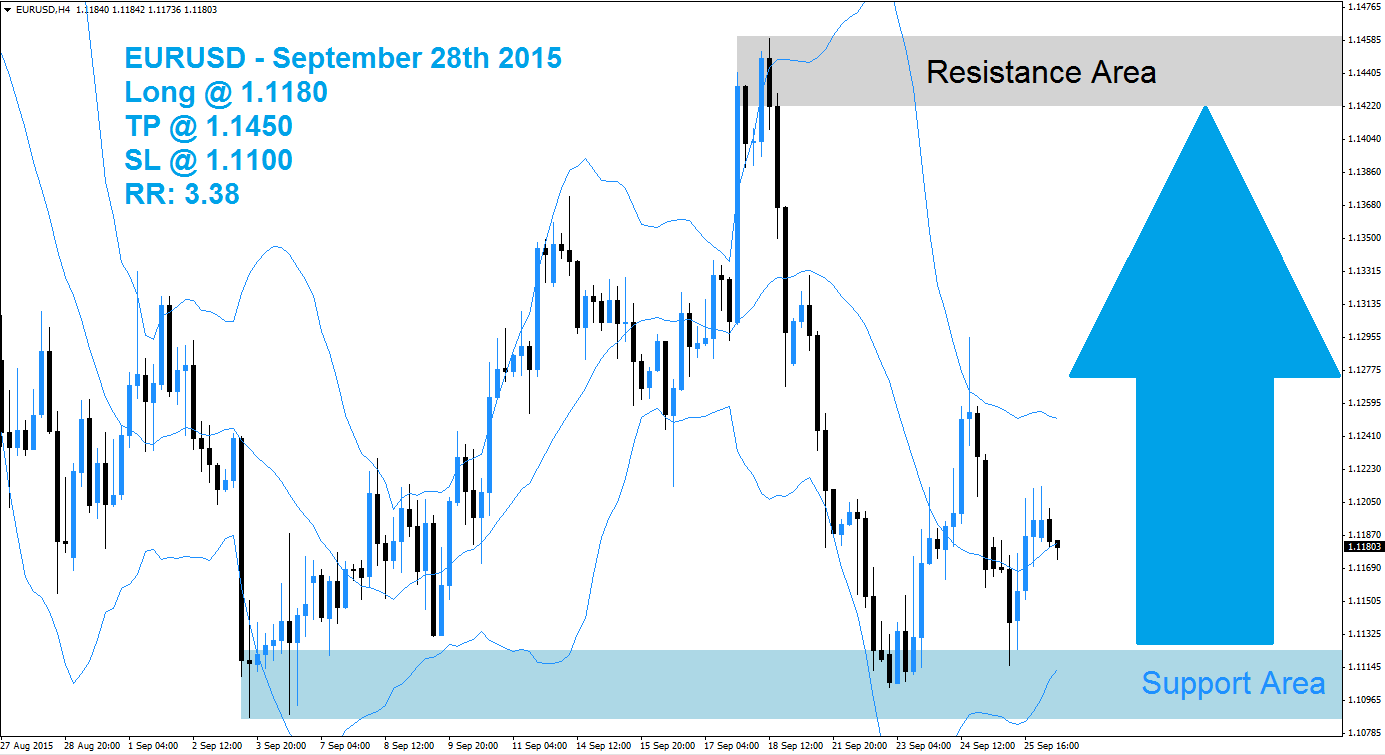
The EURUSD was able to drift higher after breaking into its support area which is marked in light blue in the above H4 chart. The sell-off which led to this break-in was started after a strong rally took this currency pair into its resistance area, visible in light grey. The rally was quickly countered by an almost equally strong profit taking sell-off which took this currency pair back down into support from where the sell-off ended.
Forex traders may opt to lock in floating trading profits after the strong sell-off which will result in a short-covering rally. The Bollinger Band indicator is pointing towards a sideways trend prior to the expected rally. The lower and middle Bollinger Band are both sloping upwards and the EURUSD is trading between those two bands; the upper Bollinger Band is sloping downwards after trading above the resistance area for a short period of time.
Forex traders are recommended to seek long positions at 1.1180 and below this level which will position their trading portfolio to profit from the expected short-covering rally. Conservative forex traders should wait for a breakout above the middle band of it Bollinger Band indicator before entering their long positions. A take profit target of 1.1450 has been set for a potential trading profit of 270pips on the H4 Chart. More buy orders are expected after the EURUSD completes its breakout above the middle Bollinger Band.
Forex traders should protect this trade with a stop loss level at 1.1100for a potential trading loss of 80 pips which will result in a Risk-Reward (RR) ratio of 3.38.
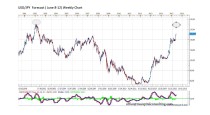
EURUSD
Long @ 1.1180
TP @ 1.1450
SL @ 1.1100
RR: 3.38
 (No Ratings Yet)
Add your review