
USDJPY trading plan.
Under 105,5, sell signals towards 101. The pair is entering a support zone, and there should be many pull backs that will give us the opportunity to enter a trade.
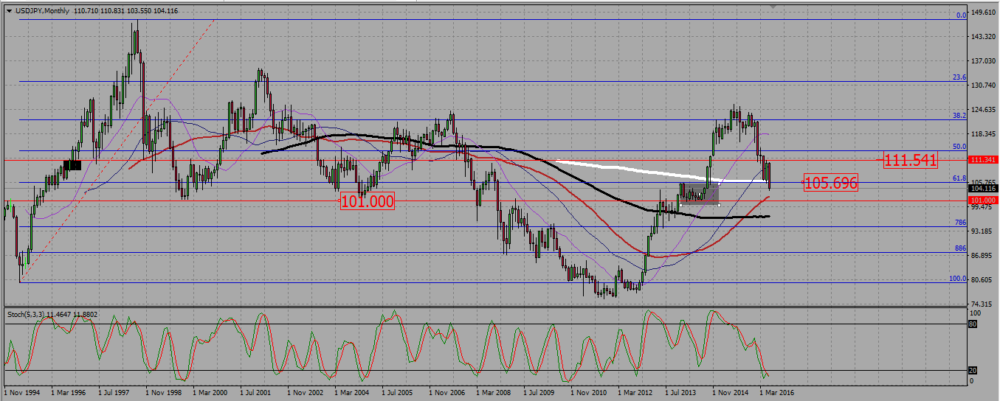
Basically the monthly chart tells it all. The pair broke an important support at 105,5. It may wish to retest it, as we see that the area under it is a little bit complicated – the grey box-. But price action shows the pressure being on the down side, and the pair should keep going down to reach the next monthly support area near 101.
USDJPY MONTHLY CHART.
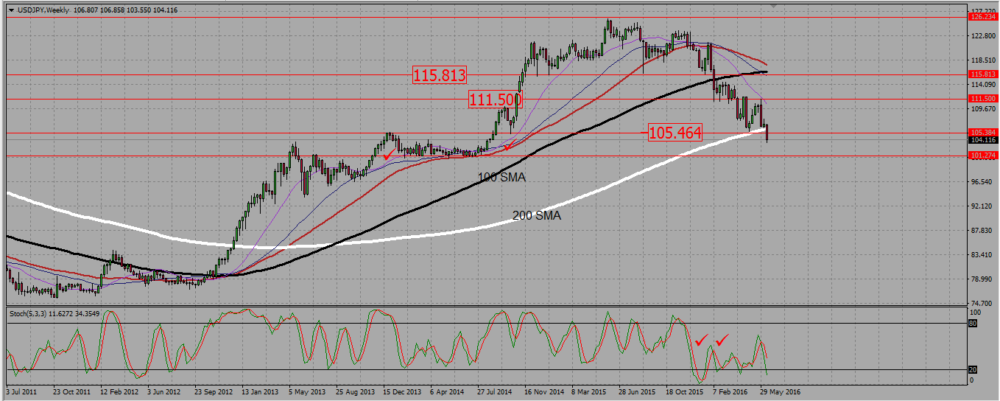
On the weekly chart we see the 105,5 support level that has been broken, and the 101 101,25 next support area. The candle that broke 105,5 is strong, and for the moment nothing shows there is going to be a retest of that level, except for a stochastic bullish divergence. But that is a kind of indicator you may want not to take into account during a trend.
USDJPY WEEKLY CHART.
I will drop here the daily chart to go to directly to the H4.
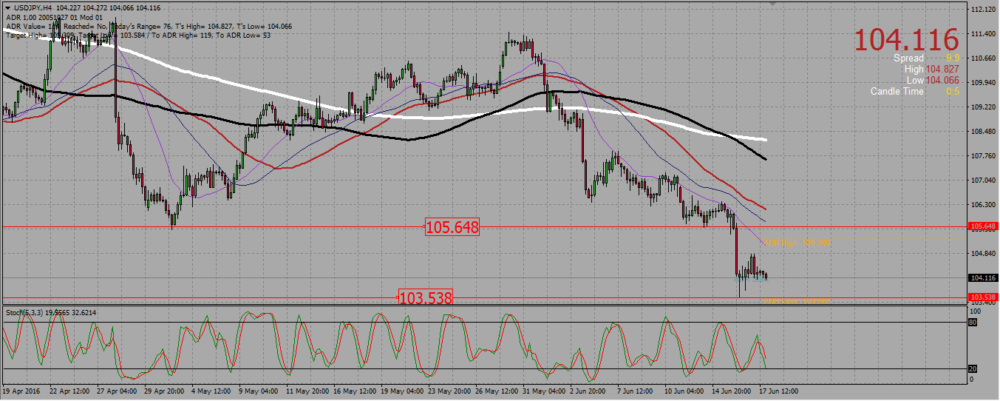
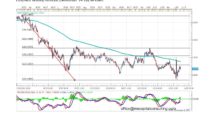
On the H4, we see that the 105,5 support (here 105,64) has been strongly broken. The pair then bounced from 103,5 with a hammer but could not make it really higher. The SMAs are in a strong downtrend mode, but we ended the week with some minor consolidation. The beginning of this week will tell us whether the pair wishes to keep on consolidating, may be to the point of retesting 105,5, or whether the trend is that strong that UJ will keep going down towards 101 – 101,25 with only minor bounces.
USDJPY H4 CHART.
 (2 votes, average: 5.00 out of 5)
Add your review