
1-EURUSD trading plan.
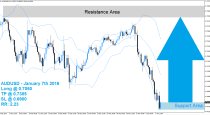
I will trade the euro as if it was in a range, with a resistance at 1,12, and a support at 1,11. This means I plan to take unconfirmed signals on reversals within that range, but only confirmed breaking outside of it. There is no point in trying to catch a trend here, as the market is still in a strong indecision mode after the Brexit. Should I open a trade, I will go to m15 and close the trade at the first reversal figure while I am in profit.
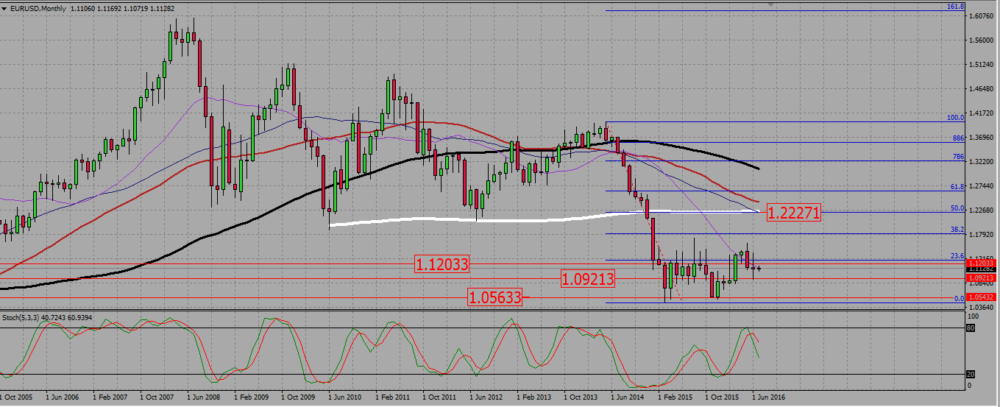
On the monthly chart, the pair ended the month with a high wave indecision candle, just under a resistance around 1,12. the SMAs suggest a rather bearish configuration, but the price action is clearly ranging.
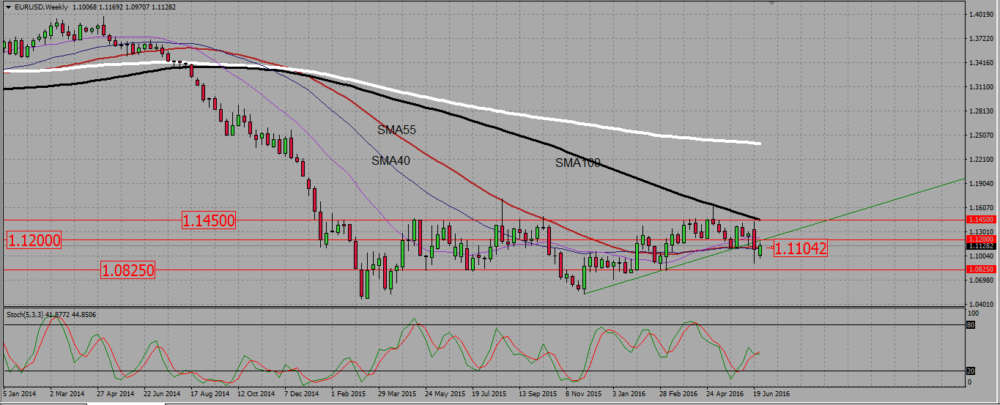
On the weekly chart the pair is within a range that started on March 2015. The last candle is a small bullish candle that closes near a resistance around 1,11, with both 40 and 55 SMAs located there. short term SMas are mixed, meaning there is no trend on that chart.
EURUSD WEEKLY CHART.
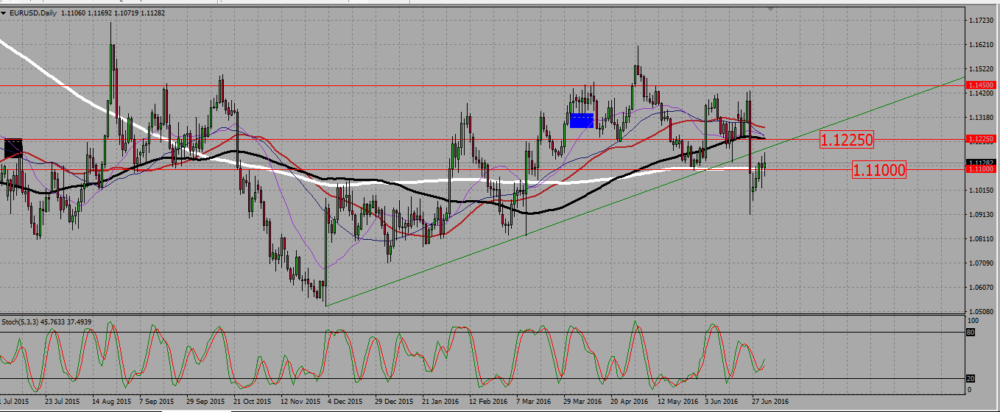
The daily chart shows us a market in shock after the Brexit : following a strong bearish candle, the pair is slowly consolidating upwards with several high waved candles, indicating an indecision. The SMAs have no clear direction norare going anywhere; in fact this is a market you do not really want to trade : sometimes having no opened position is a position.
EURUSD DAILY CHART.
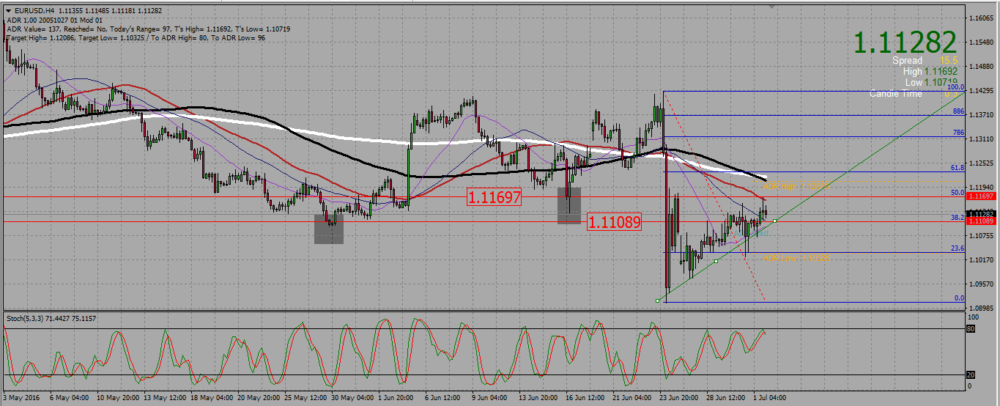
The H4 chart gives us a few clues : First SMAs are slightly bearish. Second, and following the post Brexit bearish move the pair, the pair is slowly consolidating up, and we may even draw a support trend line. Last, if we apply a Fibonacci retracement on the post Brexit bearish move, we see that two levels -38,2 and 50- are located at levels we identified as important on higher time frame charts. The 38,2 is located near 1,11, with the support trend line getting close to it, and the 50 stands near 1,12, which is a monthly range resistance. This is why I will watch those two levels, but I rather expect the pair to keep ranging, and I will be ready to close any trade I may open as soon as I see a reversal figures on shorter time frame charts, like m15 for instance.
EURUSD H4 CHART.
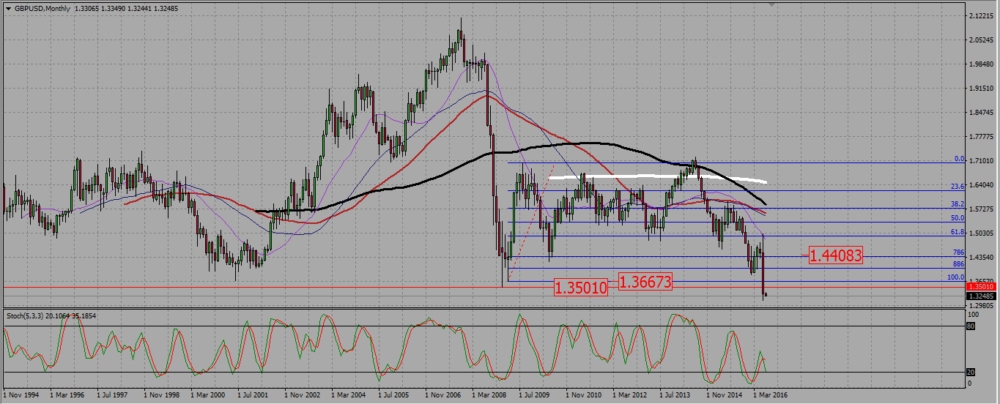
2-GBPUSD trading plan.
Sell signals under 1,35. Wait for pull backs for the pair is really low.
The monthly pair says it all : the cable broke down every support we knew, and now every signal under 1,35 is a sell. Be aware however that as the pair is very low, some sharp upwards consolidation may happen. Be patient and wait for a good signal.
GBPUSD MONTHLY CHART.
A quick look at the weekly chart : the two last candles are close to displaying a bullish harami, even though the last candle manages to make a new low. This is why you need to be patient and to wait for a good signal, for the pair may keep on consolidating up this week. However and as long as it stays under 1,35, the prevailing direction on that chart is down.
GBPUSD WEEKLY CHART.
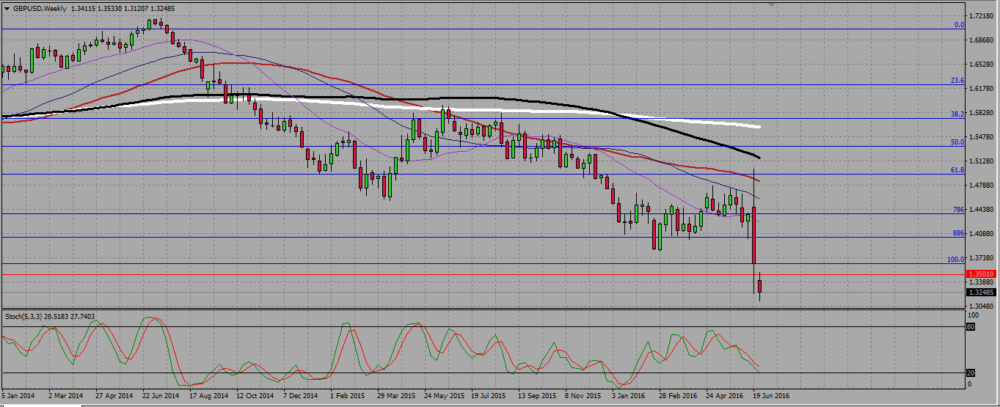
On the weekly chart, we see the pair made a try for the 1,35 resistance on Wednesday, but failed to break it and is now going down again. Therefore I prefer to sell it under 1,35, but as we all know is it a bad idea to sell a low: I will wait for some kind of consolidation and a new signal to enter a trade. And to keep it for things may get really nasty for the pound.
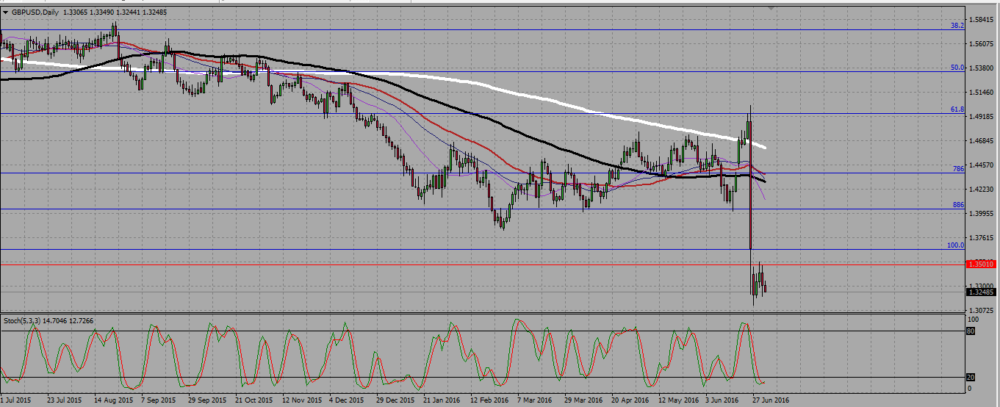
GBPUSD DAILY CHART.
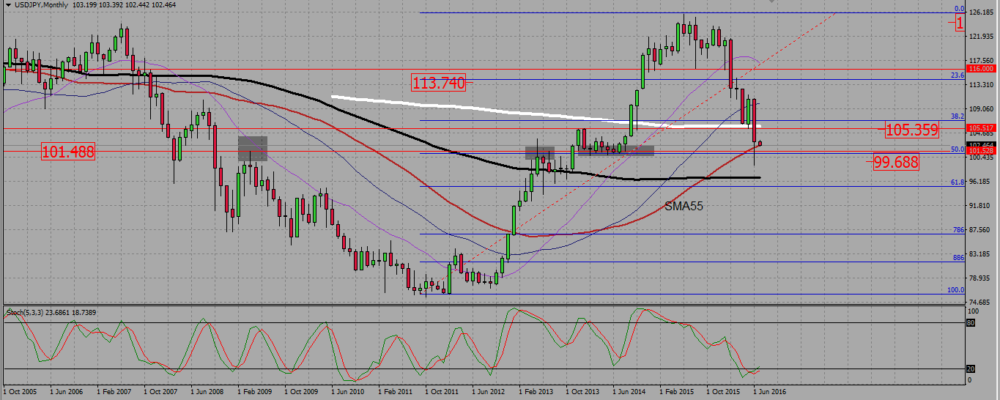
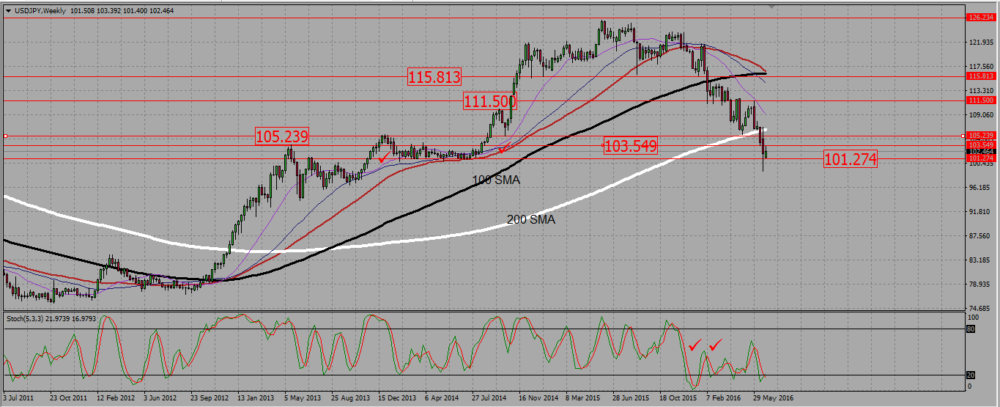
3-USDJPY trading plan.
Under 103,5, prefer selling signals, but watch out for 101,5 -101,25, which is the down limit of a weekly bullish harami pattern.
On the monthly chart the pair is still heavily consolidating down. It stand straight above the SMA55, and we may notice a potential support near 101,5, with a 50 fib line support and price action confirming a support line there (dark grey areas). Do not sell the pair near that support.
USDJPY MONTHLY CHART.
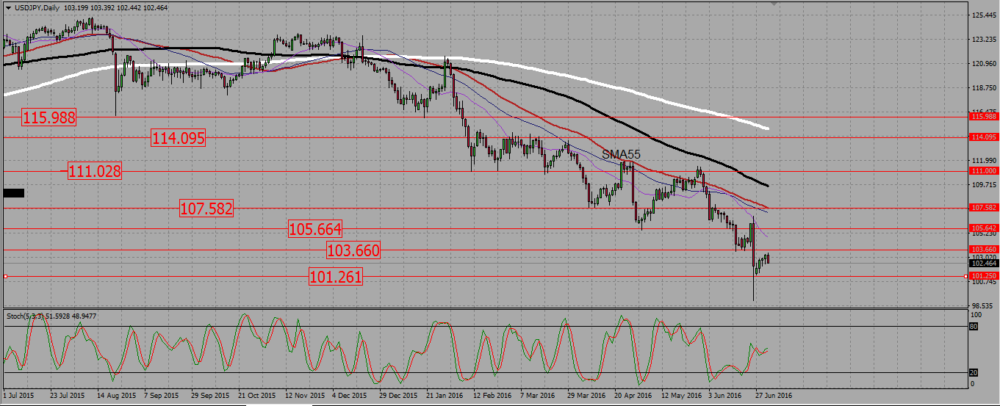
On the weekly chart we do have a bullish harami pattern with a support (invalidation) at 101,5 – 101,25. I will sell any break down of that line, but I will consider buying strong bounces to go back to the resistance area we see around 103,5. But i would wait for a confirmed break out of 105,25 to start to think bullish long term on that pair.
USDJPY WEEKLY CHART.
On the daily we notice a bearish engulfing candle rejecting the resistance at 103,5. The pair will probably now retest the support at 101,25, but I would avoid selling signals as long as the yen does not bounce from 103,5 or break down 101,25 : the market is very tricky those days and an extra dose of caution is required, even though on this chart the SMAs clearly show a strong downtrend.
USDJPY DAILY CHART.
 (1 votes, average: 5.00 out of 5)
Add your review