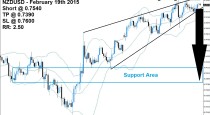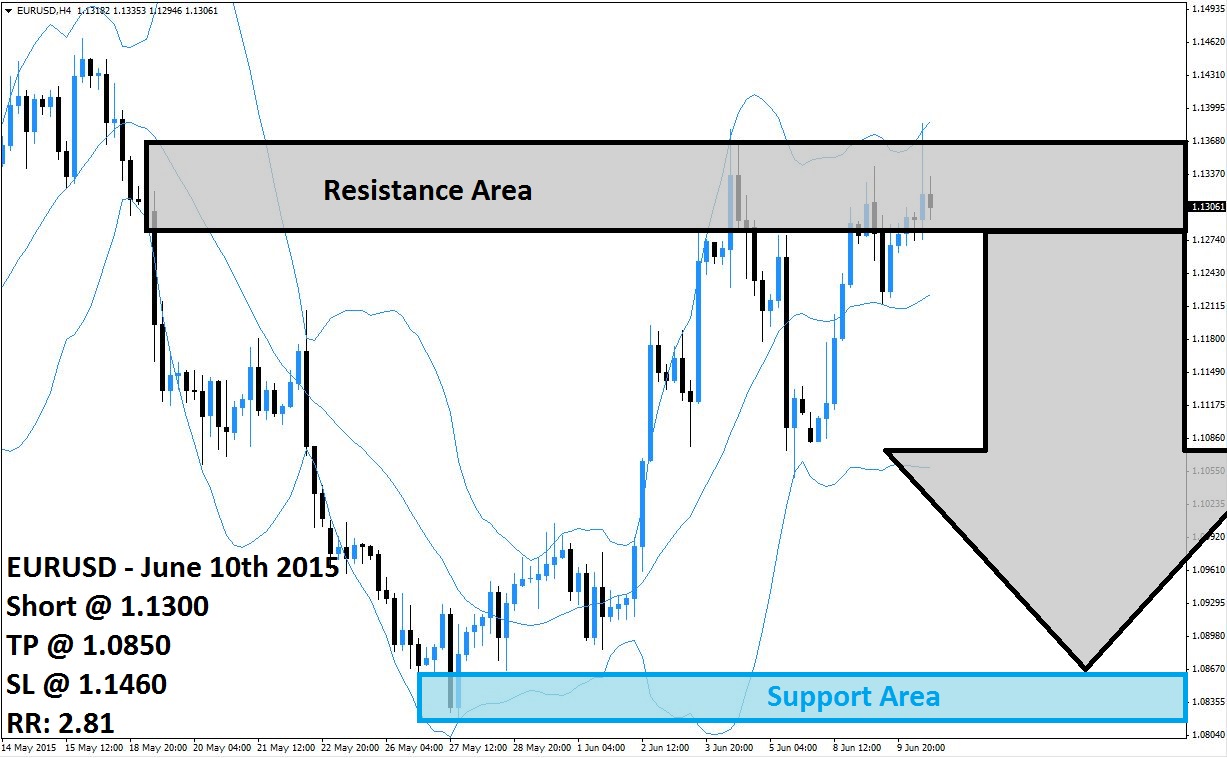
The EURUSD has enjoyed a nice rally after touching its support area, visible in light blue in the above H4 chart, which took this currency pair to tits resistance area which is visible in light grey. The Bollinger Band Indicator, which initially supported and confirmed the rally, has now started to trade sideways and therefore indicates a potential end or at least pause to the rally. The EURUSD may enter a sideways trend as well until the next move will unfold.
As price action is trading inside of its resistance area, the EURUSD may be subject to profit taking as forex traders will take this as a chance to realize floating trading profits and exit their long positions. The EURUSD is now trading between the middle band and the upper band of its Bollinger Band indicator. Once a breakdown occurs and this currency pair trades between its middle band and its lower band forex traders should expect a strong shift in momentum from bullish to bearish.
Forex traders are advised to enter short positions in the EURUSD at 1.1300 and below in order to take advantage of the expected breakdown in price action and profit taking sell-off. More conservative forex traders are commended to wait for the breakdown below the middle band of its Bollinger Band Indicator. A take profit target of 1.0850 has been set for a potential trading profit of 450 pips on the H4 Chart.
Forex traders should protect this trade with a stop loss level at 1.1460 for a potential trading loss of 160 pips which will result in a Risk-Reward (RR) ratio of 2.81.
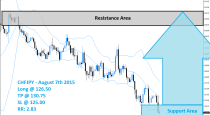
EURUSD
Short @ 1.1300
TP @ 1.0850
SL @ 1.1460
RR: 2.81
 (No Ratings Yet)