EURUSD trading plan
Sell retest of 1,11 towards 1,0925. Sell breakout of 1,0925 towards 1,055 and then 1,02.
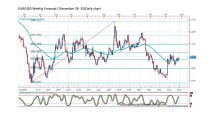
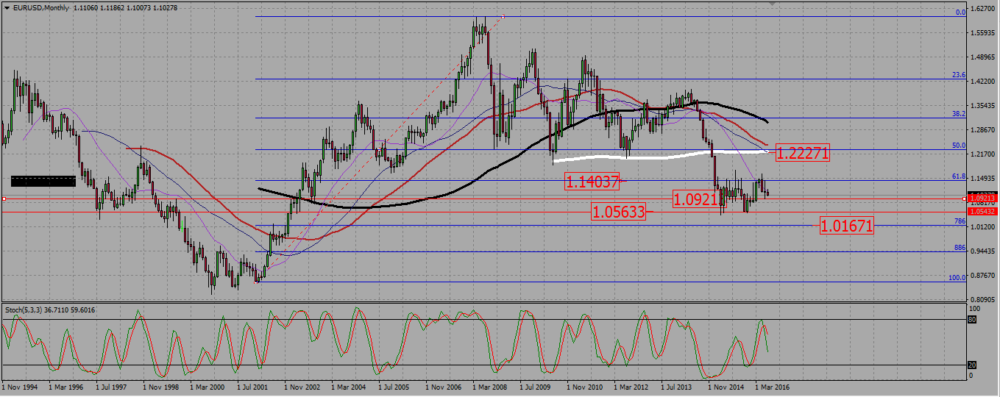
On the monthly chart the pair failed to break up a 61,8 Fibonacci resistance level around 1,14, and is now retesting a support near 1,0925. Although the 200 SMA is rather flat, shorter term SMAs suggest a bearish situation. There is however no clear trend and the euro should be traded with caution : it is ranging.
EURUSD MONTHLY CHART.
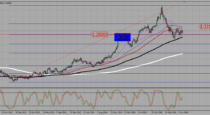
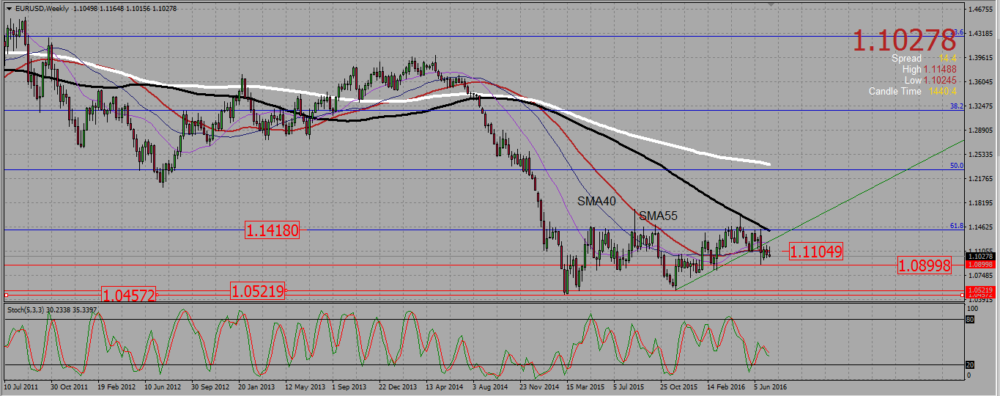
On the weekly chart the pair is trading in a range, between a support located around 1,05 and a resistance near 1,14 (the 61,8 monthly fib level). The euro has just rejected that resistance four weeks ago, but it failed to go lower since then. As long as it does not manage to make a new low (under 1,09 -1,0925), enter only crystal clear trades, meaning a pull back to a resistance and a strong signal. The SMA40 and SMA55, currently near 1,11, offer a good place to look for trades opportunity.
EURUSD WEEKLY CHART.
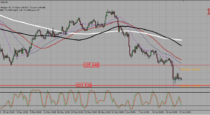
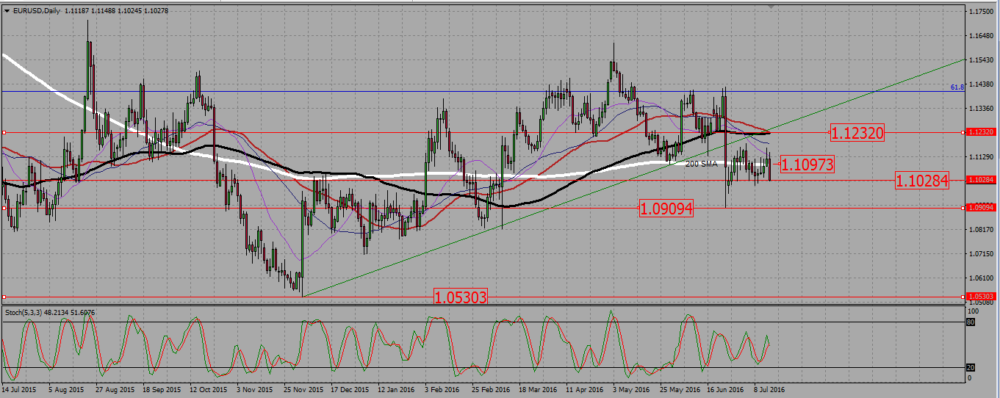
On the daily forex chart, the rejection of the monthly 61,8 Fibonaci resistance looks strong, to the point of breaking a trend line that supported the bullish consolidation that started in November 2015. However, since then the pair has been trading in a range around the 200 SMA, with a support around 1,10. Taking into account the analysis from the weekly and monthly chart, I expect that pair to go down, but in such a ranging situation I need first to wait for the pair to pull back to a resistance before considering entering a trade.
EURUSD DAILY CHART.
 (2 votes, average: 5.00 out of 5)