
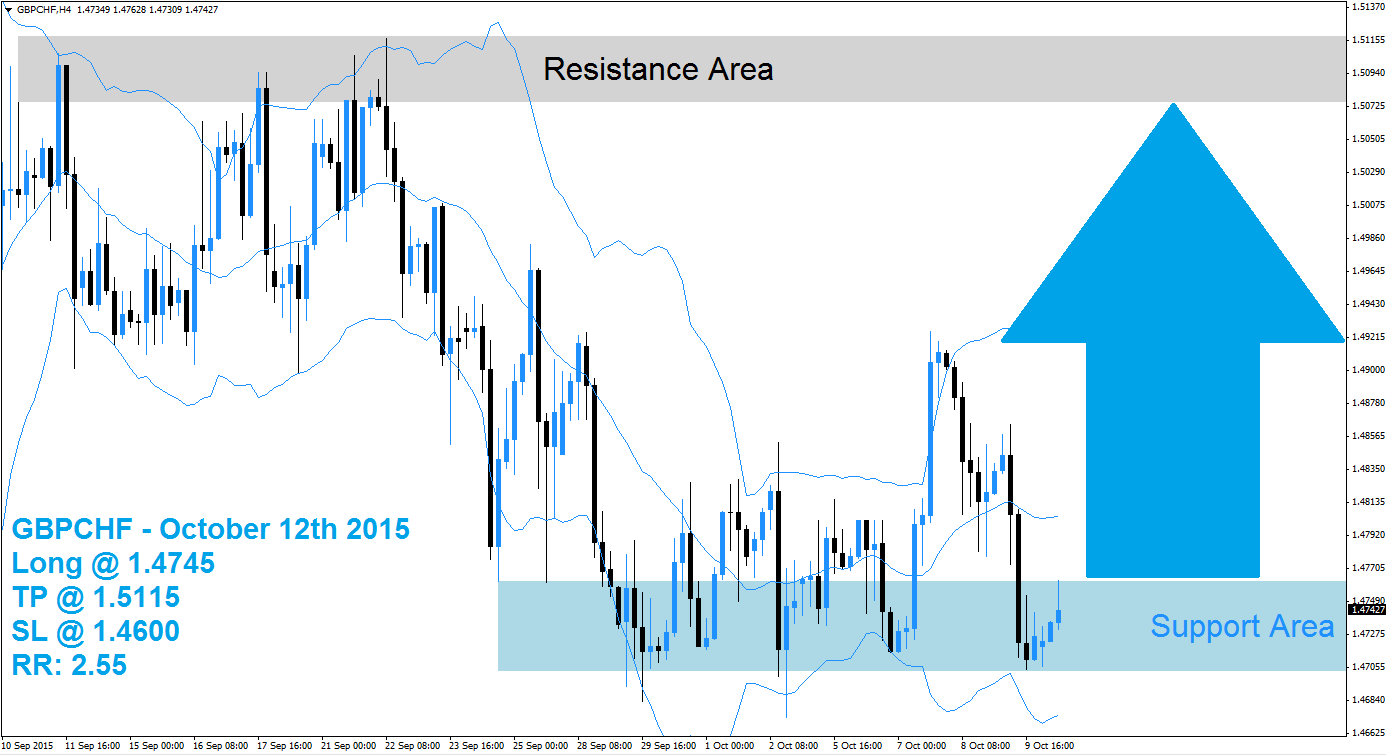
The GBPCHF is trading inside of its support area, marked in light blue in the above H4 chart, after a breakout took this currency pair above it. The Bollinger Band indicator suggests a sideways trend as all three bands are trading sideways. The lower band is trading below the support area and the middle band as well as the upper band are trading above it. The GBPCHF is trading between the lower band and the middle band, which have enclosed the support area.
The expected sideways trend could result in a short-covering rally as forex traders may opt to lock n profits during the sell-off which started from inside its resistance area visible in light grey. Existing short-positions are likely to be closed if this currency pair will breakout above its support area as well as above the middle band of the Bollinger Band indicator. A breakout above the middle band is also expected to lead to the addition of new net long positions.
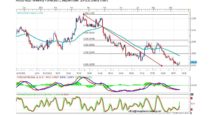
Forex traders are recommended to enter long positions at 1.4745 and below this level in order to take advantage from the expected short-covering rally. Conservative forex traders should wait for a breakout above the middle band of it Bollinger Band indicator before entering their long positions. A take profit target of 1.5115 has been set for a potential trading profit of 370 pips on the H4 Chart. More buy orders are expected after the GBPCHF completes its breakout above the middle Bollinger Band.
Forex traders should protect this trade with a stop loss level at 1.4600 for a potential trading loss of 145pips which will result in a Risk-Reward (RR) ratio of 2.55.
GBPCHF
Long @ 1.4745
TP @ 1.5115
SL @ 1.4600
RR: 2.55
 (No Ratings Yet)
Add your review