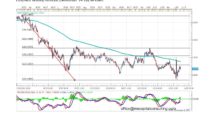
The GBPUSD plunged into its support area, visible in light blue in the above H4 chart, after a rally failed to lift this currency pair into its resistance area which is marked in light grey. The Bollinger Band indicator supported the rally until the breakdown in price action occurred at which point the Bollinger Band indicator support the sell-off. The lower band is trading below the support area and the middle band as well as upper band are trading above it.
This currency pair is now trading between the lower band and the middle band, but above its support area. Forex traders are expected to realize floating trading profits by closing existing short positions. A breakout above the middle Bollinger Band will add further net long positions in the GBPUSD which can take this currency pair back into its resistance area. The upside potential is very attractive with limited downside risk.
Forex traders are recommended to enter long positions at 1.4930 and below this level in order to take advantage from the expected short-covering rally. Conservative forex traders should wait for a breakout above the middle band of it Bollinger Band indicator before entering their long positions. A take profit target of 1.5290 has been set for a potential trading profit of 360 pips on the H4 Chart. More buy orders are expected after the GBPUSD completes its breakout above the middle Bollinger Band.
Forex traders should protect this trade with a stop loss level at 1.4850 for a potential trading loss of 80 pips which will result in a Risk-Reward (RR) ratio of 4.50.
GBPUSD
Long @ 1.4930
TP @ 1.5290
SL @ 1.4850
RR: 4.50
 (1 votes, average: 5.00 out of 5)