Subscribe to Updates (Weekly forex analysis by Stephen L) via Email
GBPUSD trading plan.
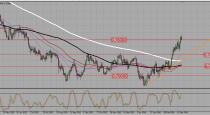
The pair closed under 1,30, and it is a sale, but it is very low already. Wait for some pull back to a resistance before selling. Watch also price action around July lows around 1,285 and 1,28.
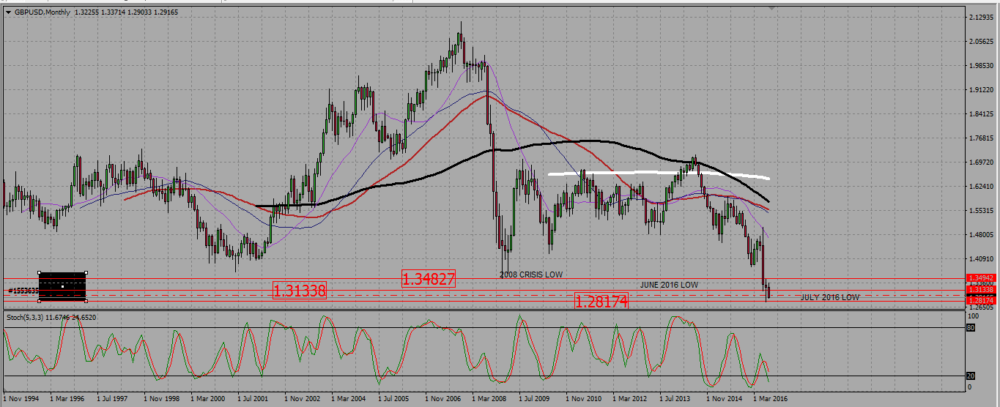
On the monthly chart, the cable posted some kind of hammer in July, but the pair seems now like getting south to retest the July lows at 1,28 and1,285. I do not want to sell it above such supports, and prefer to wait for some pull back to resistances before entering into a trade, namely the 1,30 level and the low of June 2016 around 1,33.
GBPUSD MONTHLY CHART.
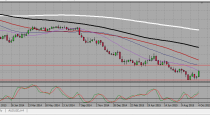
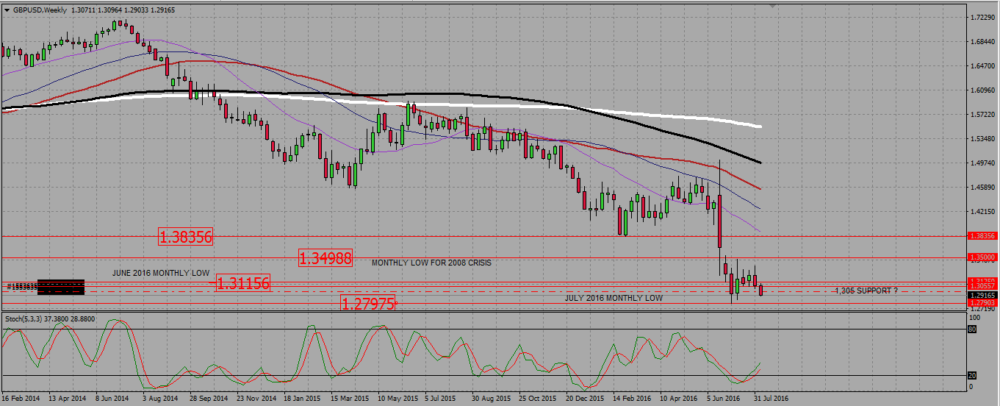
On the weekly chart we have two nice bearish candles; the pair is probably going down to retest the lows of July around 1,285 and 1,28, and I will closely monitor price action there. In case of a strong rejection, is is possible to consider short time counter trend buying, with a take profit level at 1,29 or 1,30. I would rather wait for a pull back to resistances to look for a short trade signal.
GBPUSD WEEKLY CHART.
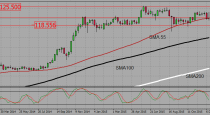
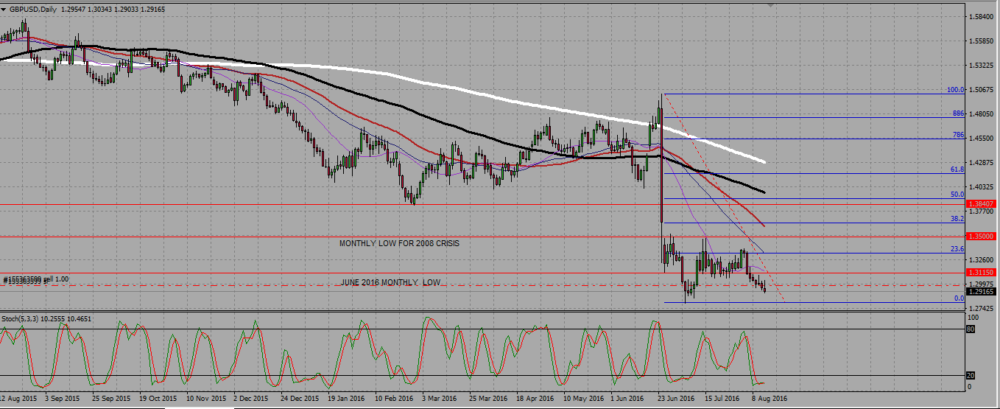
The daily chart is a down trend, but also the reason why I need some pull back before selling the cable; the last candles are small. This means the pair has to fight hard to get lower. In such a situation, and especially in August, it may reverse quite strongly at any moment. Although it is a clear downtrend, it is much safer to wait for a pull back before selling.
GBPUSD DAILY CHART.
 (1 votes, average: 5.00 out of 5)