
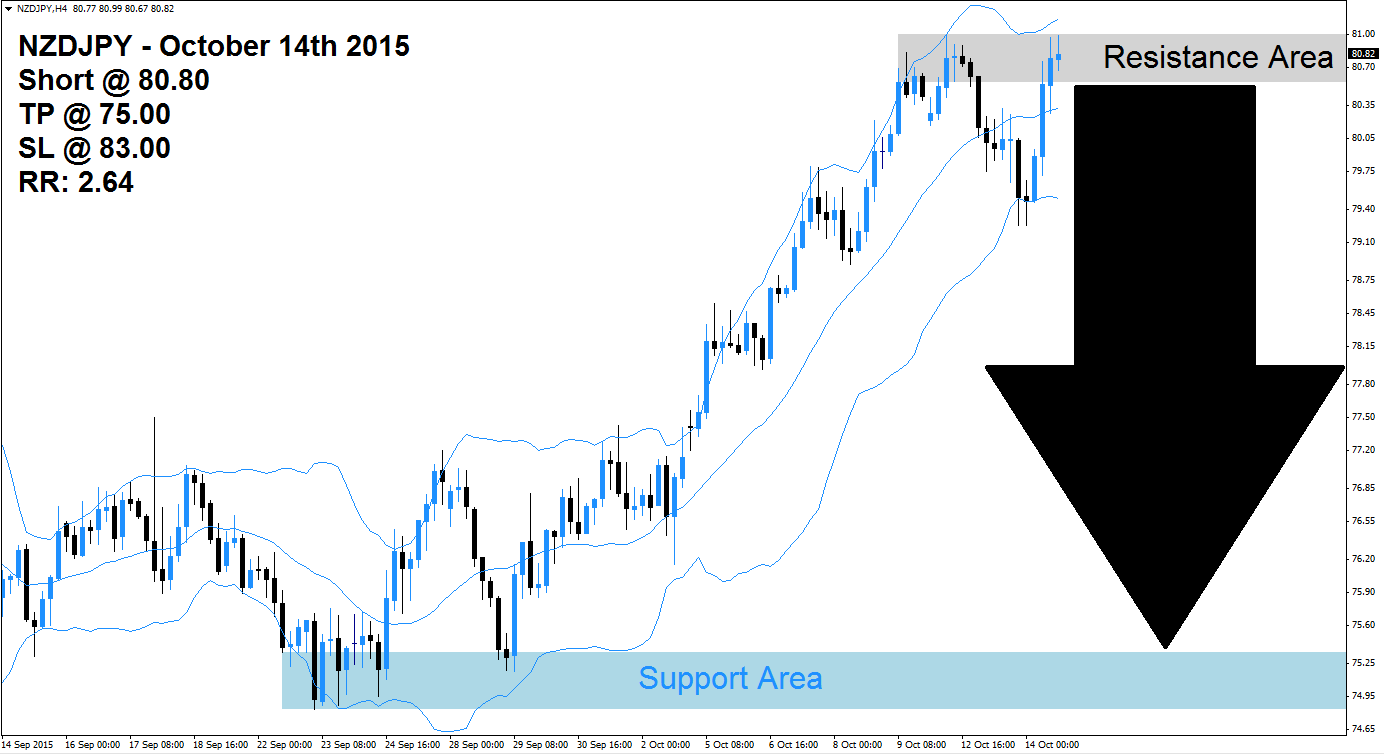
The NZDJPY rallied into its resistance area which is marked in light grey in the above H4 chart. The upper band of the Bollinger Band indicator broke out above its resistance area, but started to trend sideways. The middle band as well as the lower band are trading below the resistance area and are sloping to the upside.This currency pair is trading between the middle band and the upper band, inside of its strengthening resistance area.
This currency pair is expected to fall victim to a profit taking sell-off as forex traders will seek to realize floating trading profits by closing their long positions. A breakdown of the NZDJPY below its middle band of the Bollinger Band indicator will change momentum and is also expected to result in the addition of new net short positions. The NZDJPY could sell-off into its support area visible in light blue, especially after this currency pair will breakdown below the lower band of the Bollinger Band indicator.
Forex traders are advised to enter short positions at 80.80 and above in order to be well position for the expected profit taking sell-off in this currency pair and a break in the up-trend. Conservative forex traders should wait for price action to break down below the middle band of its Bollinger Band Indicator which will increase selling pressure. A take profit target of 75.00 has been selected for a potential trading profit of 580pips.
Forex traders should protect this trade with a stop loss level at 83.00 for a potential trading loss of 220pips which will result in a Risk-Reward (RR) ratio of 2.64.
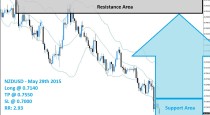
NZDJPY
Short @ 80.80
TP @ 75.00
SL @ 83.00
RR: 2.64
 (No Ratings Yet)
Add your review