Technical Analysis by IFCmarkets
Dear Traders, today we will study a new instrument created on the basis of the Personal Composite Instrument – PCI technology: the currency index &VSUSD_Index. The following index shows the USD variations against other segments of the Forex market. For a systematic FX market indicator we are going to use a portfolio of the most liquid currencies traded against USD:[EUR(12.7%)+JPY(14.5%)+GBP(17.5%)+CHF(19.1%)+AUD(18.1%)+CAD(18.1%)]/USD. The price of each currency is expressed in USD. The weights are determined in accordance with the currency liquidity relative to the volume of international bank circulation. You can get more information and online index chart by clicking on the anti-dollar index page &VSUSD_Index. The reaction of &VSUSD_Index to the US fundamental economic events is quite stable and the index forms a sustained trend channel, while it is less susceptible to the fundamental events of other currencies.
Let us not forget that today, in the US will be released Core Retail Sales. Every month, the US Census Bureau releases the indicator, which shows relative change in the retail sales volume of all the goods (except for cars), which amounts to 20% of the total volume. CRS is the monthly measurement indicator, which measures all goods sold by retailers based on the retail stores sampling of different types. The index determines the confidence and demand of consumers, and therefore, it can affect significantly investor’s preferences. Though &VSUSD_Index is still in a state of uncertainty, however it is waiting for new fundamental signals.
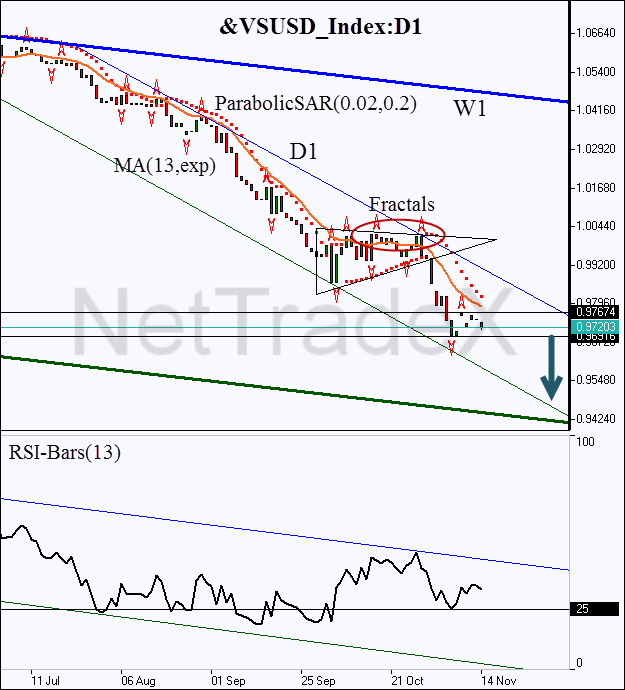
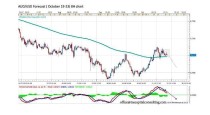
Now let us consider the daily closing/opening price chart of the following instrument created in NetTradeX platform. As we can see the price crossed down the moving average (13), and it is preparing for a fractal support breakout at 0.96916. Parabolic affirms the price trend, as well as the RSI-Bars oscillator signal. As the W1 trend is under the bearish influence, we don’t have any doubt in the most probable direction of the further price movement. It should be noted that the downtrend corresponded with the breakout of the lower triangle side. The bearish pattern “double top” forms the upper side of the triangle.
The support level at 0.96916 can be used for placing a pending sell order. Stop Loss should be placed above 0.97674. This mark is strengthened by the exponential moving average, which functions as a dynamic resistance line. Conservative traders should wait for the oscillator breakout confirmation at 25% in order to confirm the bearish price momentum.
After the opening of a position, Stop Loss is to be moved after the Parabolic values, near the next fractal high. Updating is enough to be done every day after a new Bill Williams fractal formation (5 candlesticks). Thus, we are changing the probable profit/loss ratio to the breakeven point.

 (1 votes, average: 2.00 out of 5)