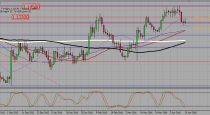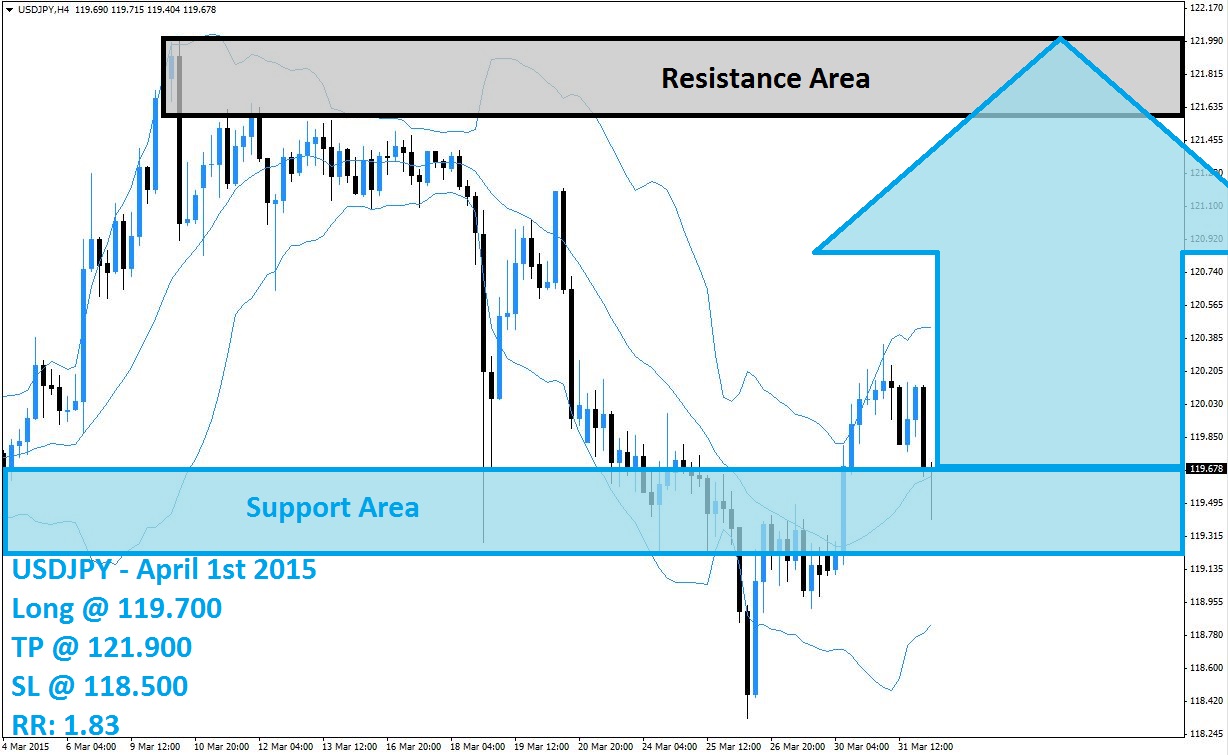
The USDJPY is recovering from a false breakdown below its support area which occurred as a result of a sharp sell-off from its resistance area which is marked in grey in the above H4 chart. The USDJPY was unable to breakout above its resistance area and the uptrend was terminated which was followed by a sharp sell-off spanning over a dozen trading days. The accumulated downward momentum was strong enough to pierce through its support area which is marked in light blue in the above chart.
The low band of its Bollinger Band indicator followed suit and broke down below support as well. Price action quickly reversed and the USDJPY started to rally from well below the lower band of its Bollinger Band indicator all the way to the upper band. The strong rally initially took the USDJPY back inside of its support area and then powered this currency pair into a breakout above it; this move has been reversed as well and the USDJPY is now trading back inside of its support area.
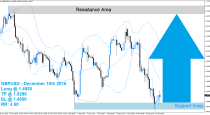
Forex traders should be prepared for more upside in this currency pair and are advised to position their forex account for more upside with long positions at 119.700 and below. Economic data out of Japan is weaker than expected and the Japanese is exposed to more downside risk. A take profit target of 121.900 is recommended for a potential trading profit of 220 pips on the H4 Chart. A breakout above the support area could ignite a short-covering rally and further power this currency pair ahead.
Forex traders should protect this trade with a stop loss level at 118.500 for a potential trading loss of 120 pips which will result in a Risk-Reward (RR) ratio of 1.83.
USDJPY
Long @ 119.700
TP @ 121.900
SL @ 118.500
RR: 1.83
 (No Ratings Yet)