
TABLE OF CONTENTS:
Money Dot – free trading system by Nicola Delic. He offer this system on their Scientific Trading Machine site ( Scientific Trading Machine official website). System contain 3 MT4 indicators and 1 template file (tpl). every time you see a dot appear on your charts, money is not far behind. The system itself is quick to learn and extremely easy to implement. Even if you are completely new to trading
Download Free Money Dot Trading System >>
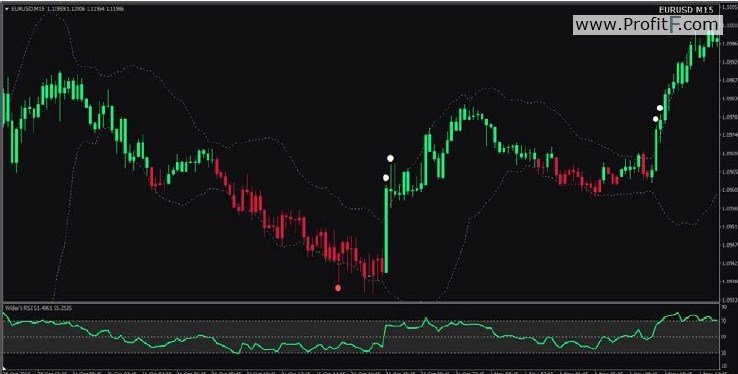
Your MT4 chart with “Money Dot”:
Before you can start trading Buy and Sell trade setups using the Money Dot trading system you need to get familiar with the individual components of the system. There are three indicators that are used in this system.
The first indicator is called the Money Dot indicator,
the second indicator is referred to as the Wilder’s RSI
and the third indicator is known as the Bands.
Let’s take a closer look at each of these indicators. As you can see on the image below, the Money Dot indicator is fairly easy to read. It comprises of Red dots that appear below Red colored bearish candles and White dots that appear above Green colored bullish candles. This indicator is used to determine whether the trend is about to reverse. On the left hand side of the chart below you can see the White dots appear before price moves downwards and on the right hand side you can see the Red dots have formed just before price has started to move upwards.
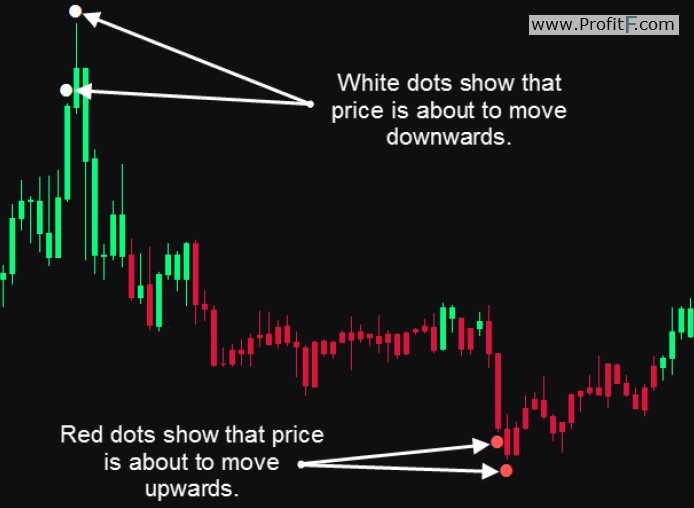
The Money Dot indicator will ultimately determine the direction in which we trade. If the Money Dot indicator dots are Red, we will be looking to enter the market with Buy trades. On the other hand, if the Money Dot indicator dots are White, we will be looking
to enter the market with Sell trades.
The second indicator we will be using is the Wilder RSI. This indicator sits below the price chart and comprises of a Green line that oscillates between the upper and lower levels. This indicator helps to confirm the market direction and alert us to the best places to enter our Buy and Sell trade orders.
On the following chart image, you can see the Wilder RSI indicator:
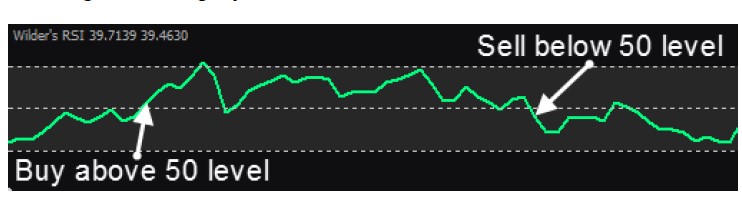
You will notice that there are three horizontal lines or levels drawn on this indicator. The middle line is the 50 level, the lowest line is the 30 level and the highest line is the 70 level. The key level is the middle line also known as the 50 level. When the Green line on the Wilder RSI indicator appears above the 50 level it means the trend is Bullish and we may only consider Buy trades. When the Green line on the Wilder RSI indicator appears below the 50 level it means the trend is Bearish and we may only consider Sell trades. While the 70 level and the 30 level do not play a major role in identifying trade signals, they do inform us of cases where price is entering overbought and oversold territories respectively.
This information assists us in determining when price has gone too far in any one particular direction. With this information we can identify potential turning points that can prompt us to tighten our stop losses in order to protect the profits we have
accumulated on our open positions.
The third indicator we will be using in the Money Dot system is simply known as the Bands indicator. On the following page you can see an example of this indicator and learn more about how we use it in our analysis. The Bands indicator comprises of two dashed lines and appear above and below the candlesticks on our charts. I refer to these lines as the Upper Band and the Lower Band. The Bands automatically widen when volatility increases and narrow when volatility decreases. The upper and lower Bands can be thought of as a measure of volatility to
either the upside and downside.
On the following image you can see an example of the Bands in action:
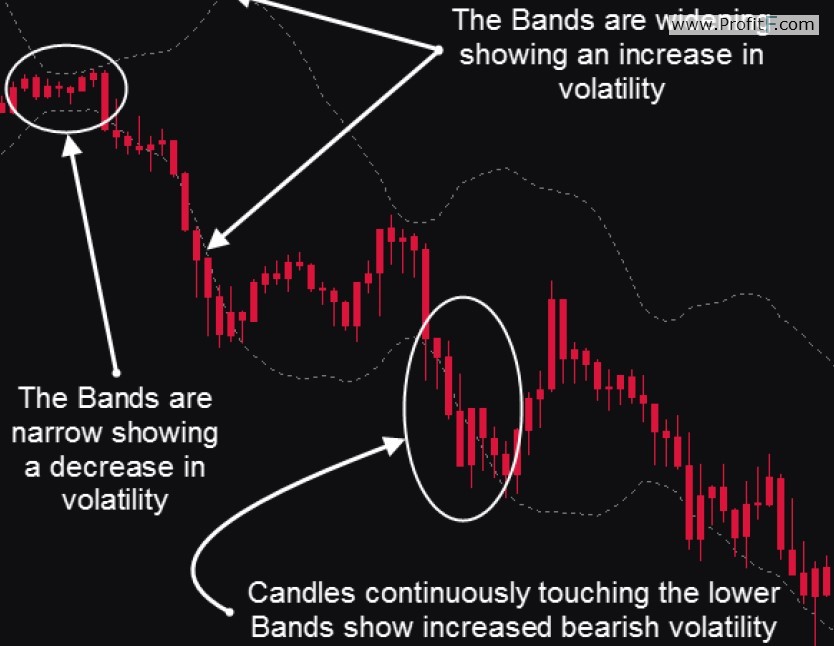
On the top left corner you can see there is low volatility and the bands have narrowed close together. We would not enter trades here. Shortly afterwards you can see that price starts to move downwards and the volatility increases so the bands start to widen. Finally, you can see a region where price remains at the lower Band showing strong downward volatility. This is an ideal area to be selling this currency pair. This is an example of a Sell trade but the same is true in the case of Buy trades as well. The only difference being that the candles will be at the upper Band instead of the lower Band.
Now that you are familiar with the indicators used as part of the Money Dot trading system it is time to get familiar with the rules for identifying Buy and Sell trade alerts. Always remember that if you encounter a scenario that does not match the rules you should avoid placing a trade. The key to trading any system successfully is ignoring your gut feel and following the rules to the letter. The same applies to this system, rely on nothing else but following the system rules and you will trade better than 90% of the traders out there.
Here are the rules for entering Buy trades:
1. There should be a series of Red candlesticks being formed on the chart.
2. Wait for at least 2 or more Red Dots to appear below the Red candlesticks.
3. Wait for the Wilder RSI to cross above the 50 level.
4. Confirm that the Bands are widening and that price is either approaching the upper Band or crossing above it.
5. Wait for a Green candlestick to close. If a Green candlestick does not close within 5 to 6 candlesticks of the last Red dot consider the signal void.
6. At the open of the next candlestick, enter the market with a Buy trade using a market order. Alternatively, enter the trade when price breaks out above the most recent Swing High. If a breakout above the most recent Swing High does not occur within 5 to 6 candlesticks consider the signal void.
7. Set your Stop Loss a few pips below the most recent Swing Low.
8. Set your Take Profit twice the distance away from the entry level as your Stop Loss or greater. I recommend a minimum of 1:2 Risk/Reward Ratio or greater.
On the following page you can see an example of a Buy trade as per the rules of the
Money Dot trading system
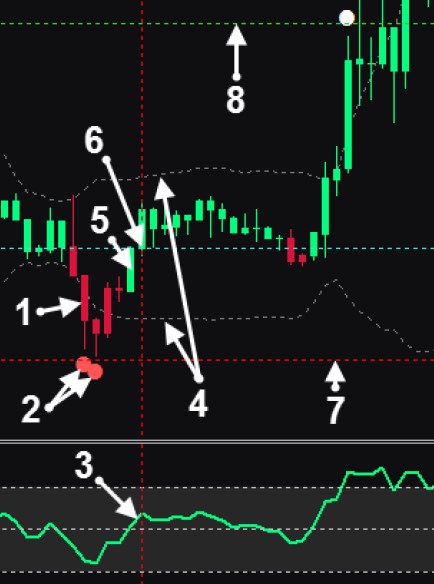
At Point 1 you can see that there is a series of Red candlesticks being formed on our price chart. At this point we are basically waiting to see 2 or more Red dots appearing below the Red candlesticks. This eventually occurs at Point 2. Remember, just 1 Red dot is not enough, we require at least 2 Red dots. If there are many Red dots, that’s even better. At Point 3 you can see that the Wilder RSI has crossed above the 50 level. We move on to the next rule and at Point 4 you can see that the Bands are wider compared to the left hand side and that price is approaching the upper Band. At this stage we wait for a Green candlestick to close which occurs at Point 5. Remember that if a Green candlestick does not close within 5 to 6 candlesticks of the last Red dot we may consider the signal to be void. In this particular trade,
the Green candlestick is formed within a few candlesticks so the condition has been met. At Point 6 we have the open of the next candlestick. This is where we enter the market with a Buy trade using a market order.
Remember that if we would have preferred a conservative entry we could have considered entering the trade when price breaks out above the most recent Swing High. In this particular case the breakout above the most recent Swing High occurs within 5 to 6 candlesticks so the entry would have been valid albeit a few candlesticks later. At Point 7 we can set our Stop Loss a few pips below the most recent Swing Low. Finally, at Point 8 we can set our Take Profit at twice the distance away from the entry level as our Stop Loss or greater. In this particular trade we used a 1:2 Risk/Reward Ratio which meant that our profit is twice as large as any potential loss we may incur should the
trade not work out in our favor. As you can see on the image above, this trade closed in profit and worked out just fine.
In fact, you’ll notice that the rules for entering Sell trades are the opposite of Buy trades. Always remember that if you encounter a scenario that does not match the rules you should avoid placing a trade. This is the single biggest reason why professional traders perform so well. We do not try to predict where the market will move instead we focus on sticking to the rules at all times.
Let’s look at the rules for entering Sell trades:
1. There should be a series of Green candlesticks being formed on the chart.
2. Wait for at least 2 or more White Dots to appear above the Green candlesticks.
3. Wait for the Wilder RSI to cross below the 50 level.
4. Confirm that the Bands are widening and that price is either approaching the lower Band or crossing below it.
5. Wait for a Red candlestick to close. If a Red candlestick does not close within 5 to 6 candlesticks of the last White dot consider the signal void.
6. At the open of the next candlestick, enter the market with a Sell trade using a market order. Alternatively, enter the trade when price breaks out below the most recent Swing Low. If a breakout below the most recent Swing Low does not occur within 5 to 6 candlesticks consider the signal void.
7. Set your Stop Loss a few pips above the most recent Swing High.
8. Set your Take Profit twice the distance away from the entry level as your Stop Loss or greater. I recommend a minimum of 1:2 Risk/Reward Ratio or greater
On the following page you can see an example of a Sell trade as per the rules of the
Money Dot trading system:
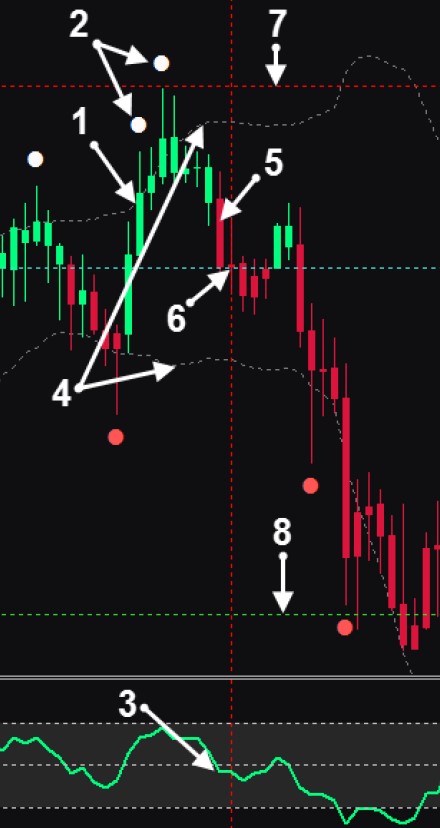
At Point 1 you can see that there is a series of Green candlesticks being formed. At this point we are waiting to see 2 or more White dots appearing above the Green colored candlesticks. This eventually occurs at Point 2. Once again,just a single White dot is not enough, we
require at least 2 White dots for the criteria to be met. If there are multiple White dots, that’s even better. At Point 3 you can see that the Wilder RSI has crossed below the 50 level. We move on to the next rule and at Point 4 you can see that the Bands are widening and price is
approaching the lower Band. At this point we need to wait for a Red candlestick to close which occurs at Point 5. Remember that if a Red candlestick does not close within 5 to 6 candlesticks after the last White dot we may consider the signal to be void and may not enter a trade. In this particular trade, the Red candlestick is formed within 6 candlesticks so the condition has been met and we may proceed. At Point 6 we have the open of the next Red candlestick. This is where we enter the market with a Sell trade using a market order.
We preferred a conservative entry we could have considered entering the trade when price breaks out below the most recent Swing Low. At Point 7 we can set our Stop Loss a few pips above the most recent Swing High and at Point 8 we can set our Take Profit at twice the distance away from the entry level as our Stop Loss or greater. As with the previous trade, we used a 1:2 Risk/Reward Ratio which meant that our profit will always be twice as large as any potential loss we may incur. As you can see on the image above, this trade closed with a healthy profit
– Avoid entering trades that follow big spikes or large candlesticks. If the Stop Loss looks too big it would be better to skip the trade and look for a better signal on a different currency pair. Always trade the currency pairs that have the most volatility. This means that you should only focus on currency pairs that are in session.
– Choose Forex broker with lowest spreads
– DO NOT over-trade. This system is designed to highlight only the very best trades so please do not bend the rules if there is no valid signal. There will always be another trade just around the corner, be patient and be prepared to take action when a signal
presents itself.
– Don’t get into trades that you doubt. Remember, trading is NOT about taking more trades and being more active. Trading is about taking fewer trades, but the best ones.
This part of “Scientific Trading Machine” system…. You can read our review of Scientific Trading Machine soon here >>

 (12 votes, average: 4.67 out of 5)
Dean Ferradaz, you need install MT4 trading platfrom for using these MT4 indicators and template. it’s free 😉
Thank you, I’ve managed to come right 😉
sir money dot template is not showing . what should i do .
try install indicators like in this guide http://www.profitf.com/articles/forex-education/install-indicators-experts-scripts-templates-mt4/
hey do you have mq4 version on moneydot
or mt5 version of the system
What TF do you recommend?
This is a very simple trading system to use. With patience one can make money from it.

Hi, I’m not having any luck installing this system…as each time it stats; “Cannot find MT4 installed on PC”. It is installed. Any Assistance would be greatly appreciated!