
As an oscillator, the MACD is commonly used to pick turning points in the markets or used to time the entries into a trade. However, unknown to most, the MACD oscillator can also help traders to plot trend lines without the element of subjectivity being involved. In this article, we outline a simple trend line trading strategy using the MACD oscillator.
Download default MACD indicator / Download Set of custom MACD indicators
How to install MT4 indicators >>
To use this trading strategy, of course, traders need to make use of the MACD oscillator, set to the default settings. We know that the MACD can show turning points in the markets. It doesn’t necessarily have to be a change in trend but merely the highs and lows that are formed with price.
Once the MACD oscillator is applied to chart, look for tops and bottoms in the oscillator and then using the ray or trend line tool connect the highs or the lows.
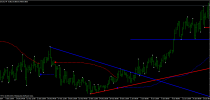
The first chart below illustrates a rising trend line that is formed by connecting the two higher lows being formed. These lows coincide with the MACD oscillator which forms the subsequent higher lows as well.
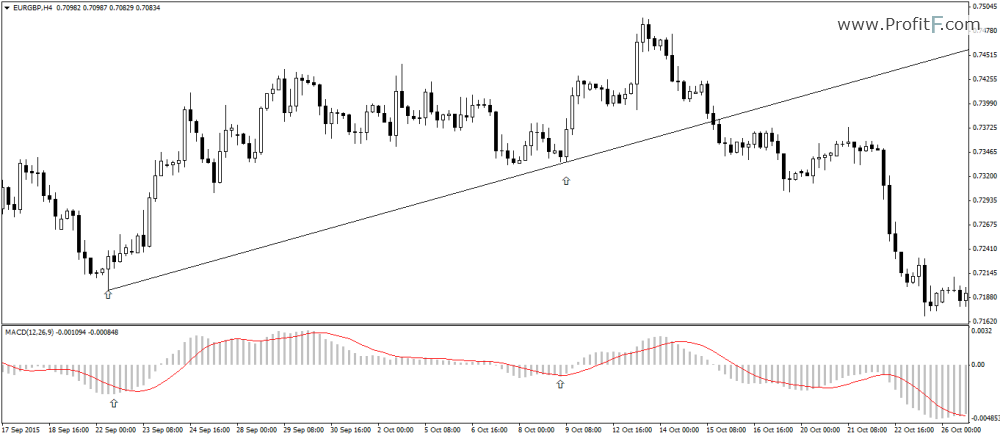
Rising Trend line – Using MACD Oscillator
In the next chart, we have a falling trend line which is formed by connecting the two consecutive lower highs which are identified by the two highs formed on the MACD oscillator.

Falling Trend line – Using MACD Oscillator
As you can see, plotting trend lines is a lot easier and simpler without the need for any subjectivity involved. Now that we know how to plot trend lines using the MACD oscillator, the next step is to define the trading rules.
To trade the trend line strategy with the MACD, traders need to have two opposing trend lines. This marks the most important part of the trading strategy. If you do not find the right MACD peaks and troughs pointing to two opposing trend lines, then it is best to stay aside from the markets.
After the two opposing trend lines are formed, the next step is to wait for a breakout from the trend lines. When prices breakout from the falling trend line, long set ups are taken and when prices break the rising trend line, short set ups are taken.
Once the set up is ready, the MACD once again acts as a trigger.
For long positions:
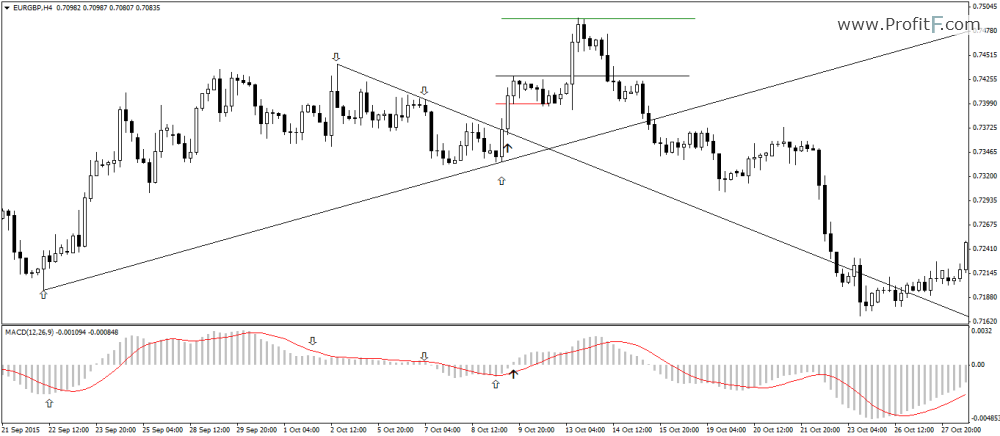
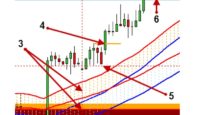
Long Position Example – Trend line/MACD Example
In the above example, from the left, we first plot the rising trend line after identifying the two consecutive higher lows being formed. At the same time, we also spot two consecutive lower highs forming on the chart and we plot the opposing falling trend line. Now that the set up is formed, when the MACD crosses the 0-line, long positions are placed at the high of the candle with stops set to the low. The take profit is set to two times the range of the candle’s high and low which is the trigger candle. Prices initially dips lower to the lower end of the range but then move out strongly hitting the take profit levels with ease.
For short positions:
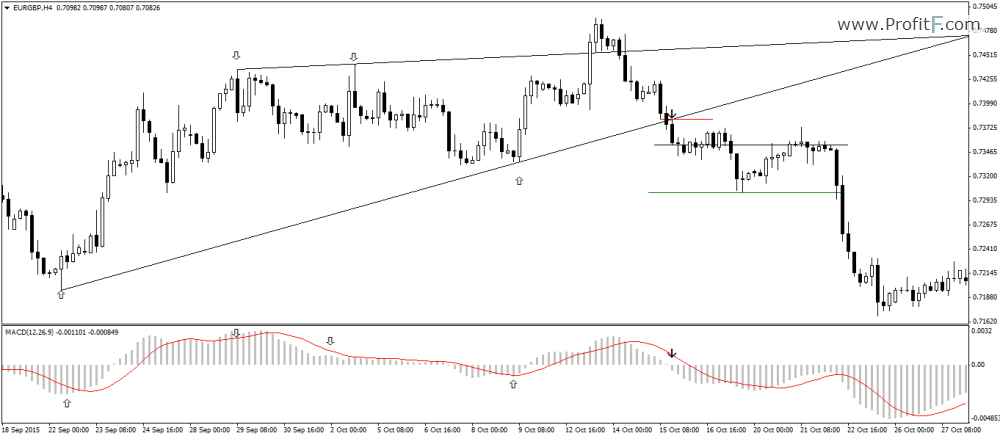
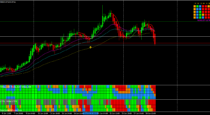
Short Position Example – Trend line/MACD Example
In the next chart above, we show an example of a short set up. Here, after plotting the trend lines, prices make a fake-out attempt from the rising trend line. Normal traders would have purchased at this break out but would have resulted in a losing trade. However, sticking to the trading rules, here we take a short position on the candle’s low where the MACD histogram crosses the 0-line. Take profit is set to two times the risk which results in a quick profit.
The MACD trend line strategy is very simple to use and doesn’t require too much of analysis. It offers a clean way to trade the markets and is very subjective, making this a good trading strategy worth trading.

 (10 votes, average: 4.40 out of 5)
Add your review