RSIOMA is the abbreviation for Relative Strength index (RSI) of moving averages (MA). This custom built indicator is based on calculating the relative strength of two moving averages and the smoothes out the RSI using a moving average. Combined, the RSIOMA oscillator depicts trend changes in prices relative to the time frame. The RSIOMA can be used as a signal generator by itself. In the chart below, the RSIOMA is applied with the default settings. The thick blue line is the RSI of the moving averages, while the thin line is the moving average of the RSI.
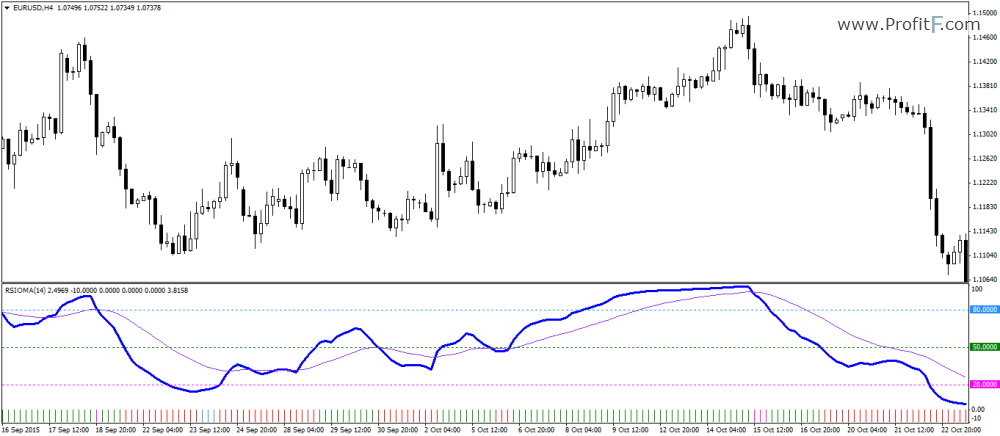
Chart set up: RSIOMA Applied to charts
The RSIOMA oscillator of course moves within specified levels and each of this signals the market’s changing trends.
The histogram that is printed below the RSIOMA oscillator merely depicts the state of the trend in the markets.
With the basic set up now in place, the RSIOMA can be traded into two main ways:
Combining the rules outlined above, long and short positions can be taken based on where the RSI is trading. Long positions are taken when the RSI is above the moving average and breaks above the 50 level. Short positions are taken when the RSI breaks below the 50 level and is below its moving average.
The chart below shows the long and short example positions that can be taken when the RSIOMA signals the appropriate buy and sell conditions. Stop losses can be set to the recent significant low for long positions and significant highs for short positions. Trades can be exited when the RSI crosses its moving average.
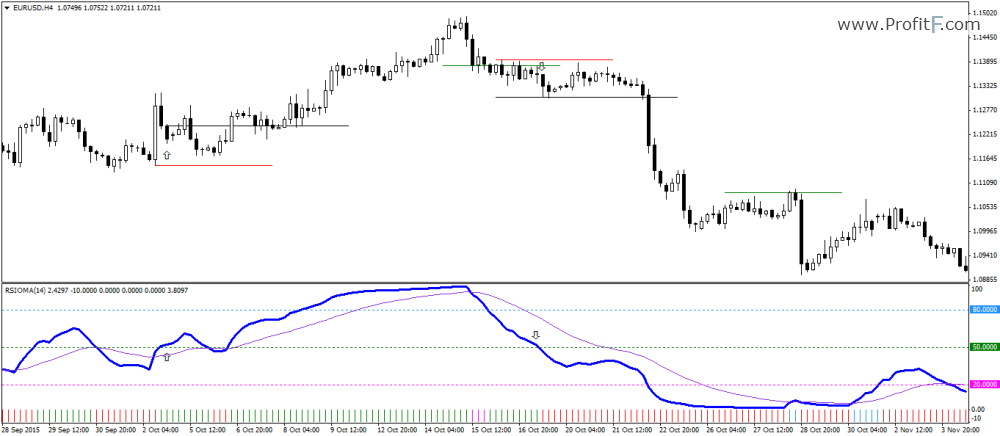
RSIOMA – 50 Line trading
The RSIOMA can be alternatively used as a divergence indicator as well. The divergence set ups formed with the RSIOMA oscillator are more powerful and more importantly, the trigger for the long and short positions can be taken by following the RSIOMA’s relation to the moving average.
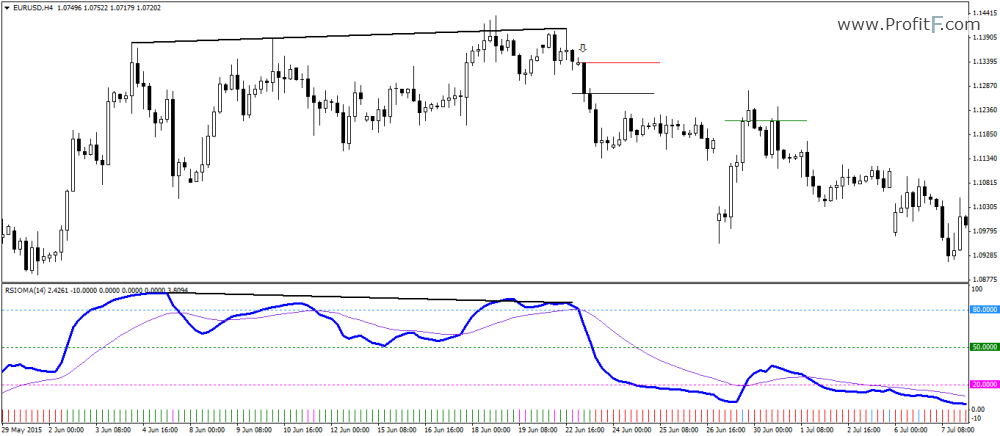
RSIOMA – Divergence Short Set up
In the above chart, an example short set up is shown based on the RSIOMA’s bearish divergence indicator. With prices posting higher high, the RSIOMA posts a lower high and indicates a potential move to the downside. Using the RSIOMA as a signal indicator, short positions are taken when the moving average is above the main RSIOMA line with stops at the high of the candle. The short positions can be exited when the RSIOMA crosses back above its moving average.
The next chart below shows the divergence long set up using the RSIOMA oscillator. Prices make a new low but it is not confirmed by the RSIOMA which makes a higher low. When the RISOMA crosses above the moving average, long positions are taken on the candle’s close and the position is exited when the RSIOMA crosses back below its moving average.
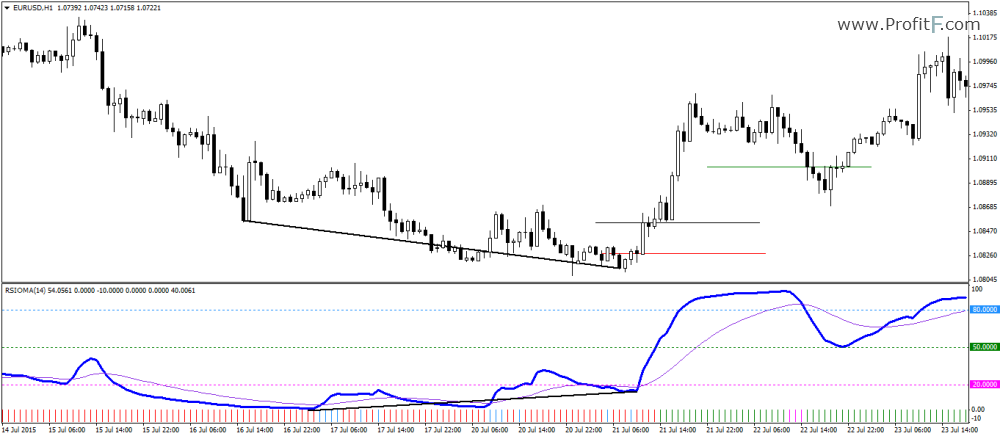
RSIOMA – Divergence Long Set up
The RSIOMA might be a custom indicator but in regards to spotting trends and direction changes, it makes for a versatile trading indicator which can be used stand alone to generate long and short signals. See other forex indicators in our Trading softare section

 (15 votes, average: 4.20 out of 5)