
The harmonic patterns way of trading is an entirely different approach to trading the markets and is based on the discovery by H.M. Gartley whose findings were presented in his book in 1935 entitled “Profits in the stock market”. The book was a lengthy one at that and back in the days it sold for a premium. The most famous aspect of H.M Gartley’s book is the Gartley 222 Pattern, named after the page number where H. M. Gartley outlines the trading methodology using the Gartley pattern.
Most traders who might have come across references to the Gartley pattern will know their close relation to Fibonacci numbers. Strangely, H.M Gartley never included the Fibonacci relation in his original work and instead used one-thirds and two-thirds of ratios between the various swing moves. It was later developed by Scott Carney and Larry Pesavento which is now widely accepted as the standard for trading the many patterns originally discovered by H.M Gartley. The Gartley patterns became the focus and choice of trading for most traders as it was proven that these patterns have a high success rate. In his book, H.M Gartley noted that in a 10 year period, the Gartley patterns had a high success rate, 7 out of 10 times.
What is the Harmonic Pattern Gartley?
Harmonic Pattern Gartley is a retracement pattern and is often said to form near market tops and bottoms in ideal conditions. The Gartley 222 pattern comes in a Bullish Gartley and a Bearish Gartley pattern and is made up of 5 pivot or swings points.
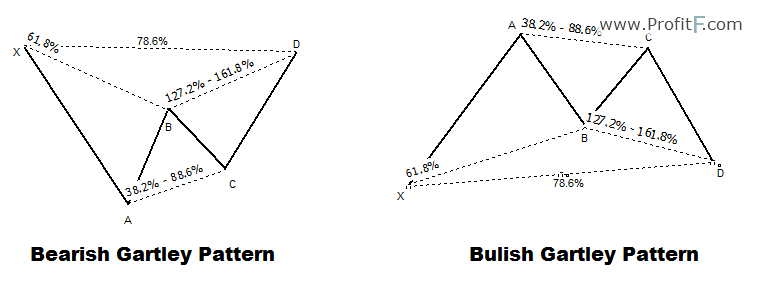
The chart below shows the bullish and bearish Gartley patterns along with their Fibonacci relationships between each of the five swing/pivot points.
The main rules of the Bullish and Bearish Gartley are as follows:
From Point D, a trade can be entered with stops at or above (below) the price point at X.
Gartley 222 Target Levels
Once a position is entered at D, profits can be booked at 61.8% of CD with the second target being the measured XA, projected from D. When trading in real time most often the markets don’t form Gartley patterns that fit the requirement to the point. Therefore, traders need to allow some room with a small margin of error. For example, a Gartley pattern may be valid even though the AB leg might have retraced 64.8% instead of 61.8%.
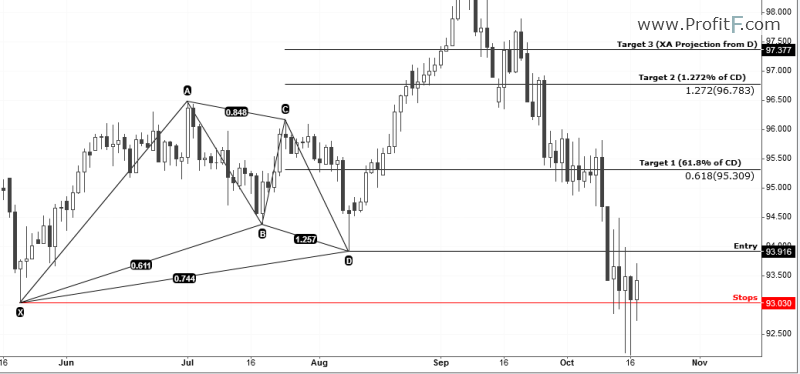
Bearish Gartley 222 – Sell Trade Example
The following chart gives an example of a Bearish Gartley pattern.
After price reached the point D, we then enter short with stops at D. The first target was 61.8% of CD, a second target was placed at 1.272% CD projected downwards and finally the third target was the projected XA distance from D.
As we can see from the above example, the Bearish Gartley pattern managed to reach all the three specified target levels.
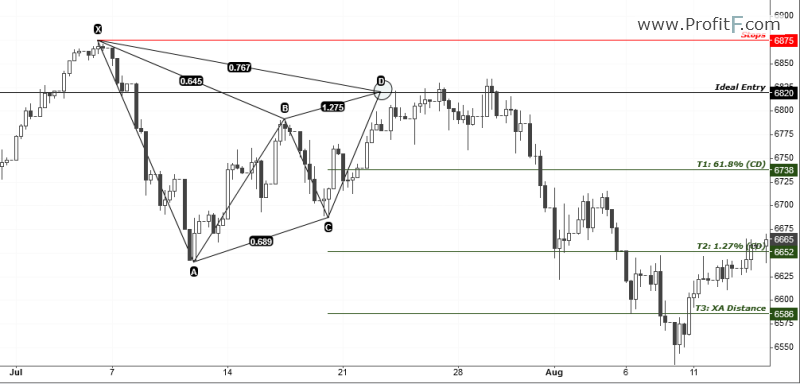
Bullish Gartley 222 – Buy Trade Example
The following chart shows an example of a Bullish Gartley pattern
A long order would be placed just above the high of the price at D with the targets set to 61.8% of CD, 1.272% extension of CD and finally the projected XA distance from D.
In the above example, we notice how swiftly price rallied from D, the PRZ or the potential reversal zone level and quickly reached all the three profit levels.
As we can see from the above, the Gartley pattern is a very simple and easy to understand Gartley pattern for those who are just getting started with harmonic trading.

 (23 votes, average: 4.43 out of 5)
Thanks for your reply! Is there a simpler way to be able to identify patterns?
Thank you for this article


I know some indicators. For example “Harmonic Pattern Indicator “korHarmonics” for MT4 – “ke-Harmonic”… but I recommend you identify pattern yourself.
PS: How to install Indicators, EA on Mac – http://www.profitf.com/articles/forex-education/how-to-install-indicators-ea-on-mac-apple/