
The ABCD pattern (AB=CD) is one of the classic chart patterns which is repeated over and over again. The ABCD pattern shows perfect harmony between price and time and is also referred to as ‘measured moves’. It was developed by Scott Carney and Larry Pesavento after being originally discovered by H.M Gartley. (see more about Gartley patterns)
Within the ABCD patterns, there are 3 types as mentioned below.
The chart below shows the three different ABCD bullish patterns.

Trading the ABCD bullish pattern
Some variations to the rule include:
The opposite rules apply for bearish ABCD patterns. The chart below illustrates a Buy trade example where we notice that BC retraced close to 61.8% (at 59.4%) after which CD travelled close to 139.6% of the AB leg. After the D point has been identified, a buy order would be place at or above the high of the candle at point D.
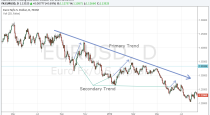
Traders should note that the ABCD count should not be confused with the ABC corrective waves from the Elliott Wave count.

The ABCD is a recurring pattern that is repeated over and over in the price charts, with each of the patterns qualify any of the rules mentioned above forming any of the 3 patterns. The ideal way to get started with the ABCD pattern is to look for highs and lows in the price. A good way would be to make use of the zig-zag indicator found with the MT4 trading platform. This indicator can automatically plot the highs and lows and thus identify the traders to any potential ABCD patterns.
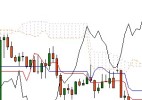
Additionally, using an oscillator helps in identifying the turning points once pivot swing point D is formed. The ABCD also forms the basis of many other chart patterns such as the three-drives patterns and also within the price channels.
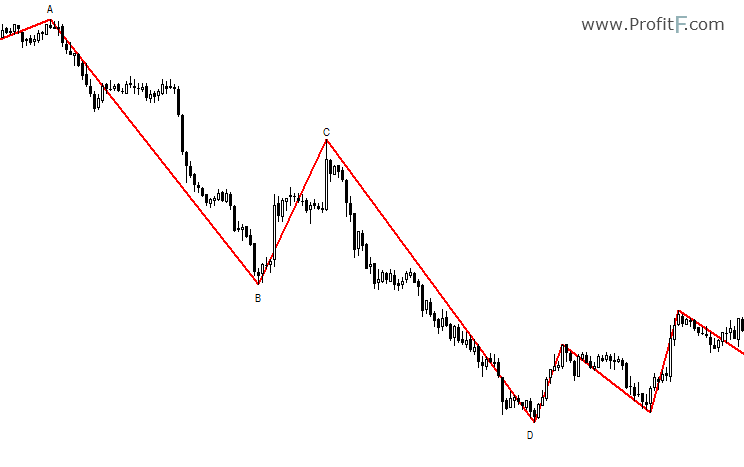
The chart above shows the bullish ABCD pattern being easily identified with the zig-zag indicator. After point D is formed, price makes a small rally right after this pivot swing low if formed. As we can see from the above, the ABCD pattern is a simple harmonic pattern that appears on the price charts frequently. If can give clues to the trader about potential future moves.
ABCD pattern indicator – coming soon….

 (35 votes, average: 4.57 out of 5)
It’s depend where you open trade… what is your MM… TimeFrame…etc. Here example if you enter on pullback:


Great article!
What about the stop loss? Where should it be placed?