
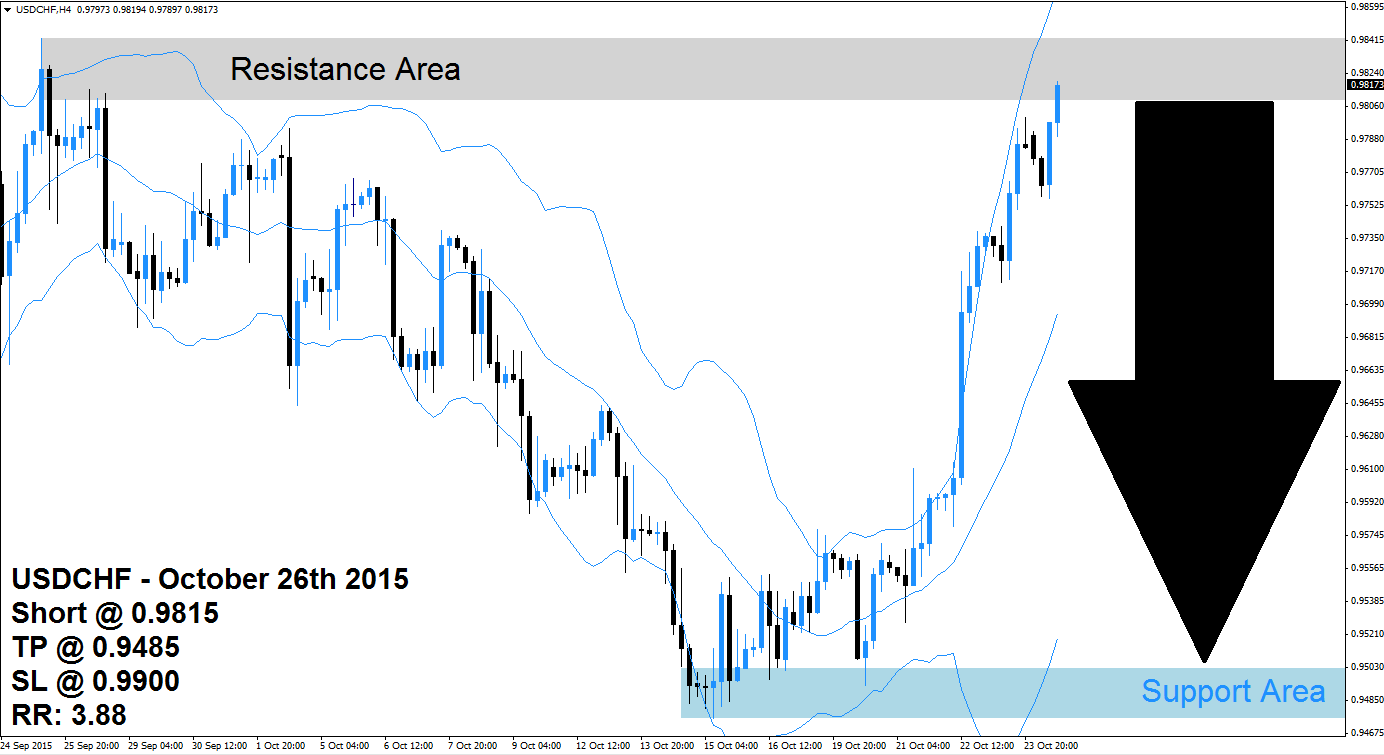
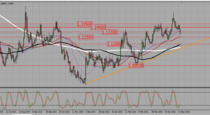
The USDCHF has rallied sharply from its support area, marked in light blue in the above H4 chart, to its resistance area which is visible in light grey. The Bollinger Band indicator has conformed the rally and the upper band was able to break out above the resistance area. The middle band and the lower band are also sloping higher and price action is trading between the middle band and the upper band. The USDCHF is now forming a double top formation.
The USDCHF is likely to face a decease in buy orders and forex traders may take the current resistance area as a good level for some profit taking by closing existing long positions in this currency pair. A breakdown below the resistance area could further add to new sell orders in the USDCHF and once price action breaks below the middle band of the Bollinger Band indicator a trend change is expected to lead the way to the downside.
Forex traders are advised to enter short positions at 0.9815 and above in order to be well position for the expected profit taking sell-off in this currency pair and a break in the up-trend. Conservative forex traders should wait for price action to break down below the middle band of its Bollinger Band Indicator which will increase selling pressure. A take profit target of 0.9485 has been selected for a potential trading profit of 330pips.
Forex traders should protect this trade with a stop loss level at 0.9900 for a potential trading loss of 85 pips which will result in a Risk-Reward (RR) ratio of 3.88.
USDCHF
Short @ 0.9815
TP @ 0.9485
SL @ 0.9900
RR: 3.88
Would you like receive more such signals?
($9 per month)
 (No Ratings Yet)
Add your review