
Subscribe to updates (PA analysis by Shehab) via email – It’s FREE 😉
During last week price on the NZD pairs experienced some major turbulence. Depending on the cross that it is paired with these moves could present with some really solid trading opportunities.
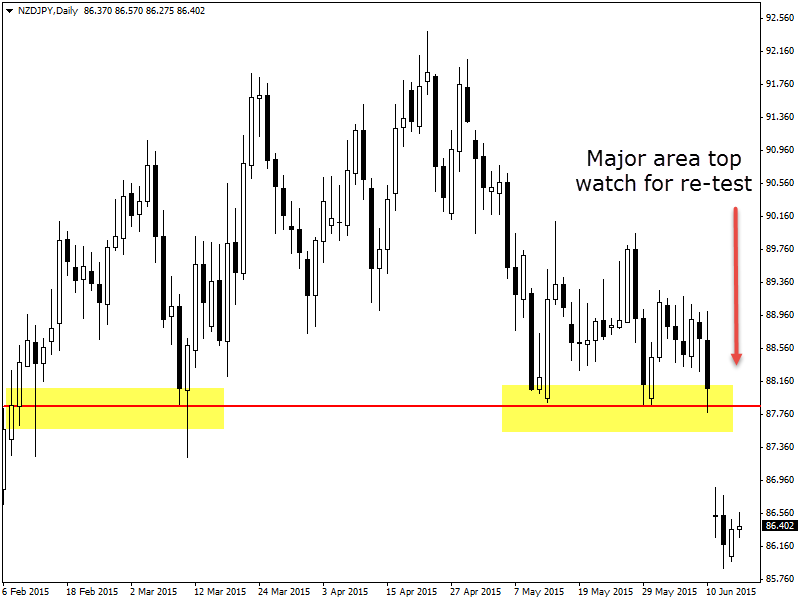
On the daily NZDJPY chart below for example; price has made a huge move and smashed lower through a super important support level that price had been sitting on top of for the last month. This support had clearly been a super relevant and key level to this market because we can see that in the past price has attempted to try and break lower with the wicks of the candle lows trying to break through, but price has not been able to close down and below.
Now that price has successfully moved and closed lower, if price can make a re-test of this old support and potential new resistance it could be a really high probability level to hunt short trades. Not only would we be trading from an obviously major level, but we would also be trading with this short term powerful move lower.
 (No Ratings Yet)
Add your review