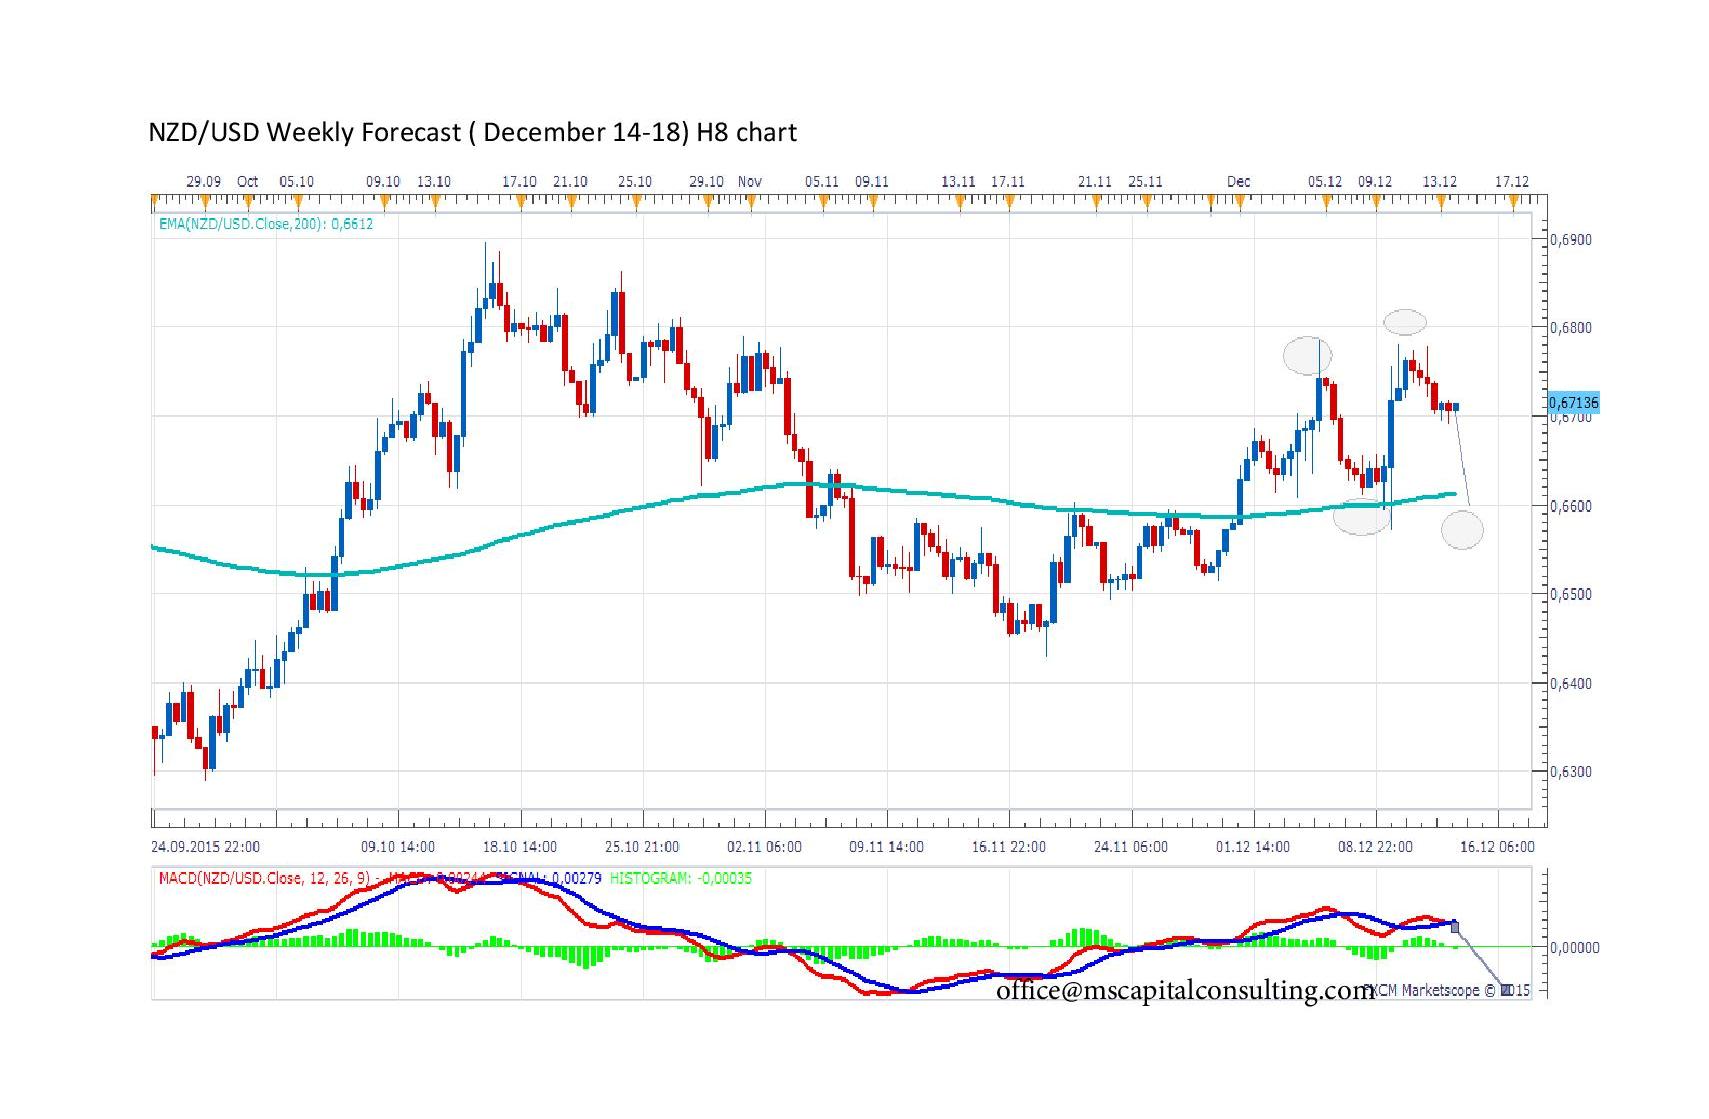
According to the MACD on 8 hour chart, the NZD/USD currency pair may fall in the medium term. A double top was above 0.67 in the short term. The first bottom was at 0.6580. This indicates that the second bottom will be at around 0.6612 where is EMA 200 on 8 hour chart. In this case, the price will fall and a new triangle can be formed at 0.6512.
The daily chart indicates a downtrend for NZD/USD in the medium term, according to the MACD. If the price reaches EMA 15 at 0.6661, NZD/USD will fall to 0.6541 where is Fibo 0.76.

 (1 votes, average: 5.00 out of 5)