BreakOuts are a common phenomenon in the forex markets and occur across different chart intervals. It is therefore no surprise that break out trading strategies have become one of the most popular ways of trading forex, besides other strategies such as trend following methods. In order to trade break outs successfully, traders need to first understand what causes the break outs, how to identify the break outs and finally learn the various ways traders can trade forex break outs. This article gives an in-depth overview about forex break outs and also presents several different forex break out trading strategies.
What are Breakouts and why do they occur?
A break out occurs when prices trade within a tight range. This is referred to a consolidation phase or more commonly sideways price action. Consolidation phases occur either before a big move or right after a big move. The consolidation phases are where prices take a pause before resuming the trend (or in some cases, starting a new trend).
Taking advantage of this consolidation phase or break out trading can be a profitable trading strategy. The forex break out trading method involves a bit of subjectivity followed by a purely mechanical approach. Trading break outs can be done either with pure price action or with the help of oscillators.
Types of forex BreakOut trading strategies
Forex break out trading strategies can be classified into the following main types:
Let’s take a closer look at each of these various break out trading strategies that can be applied to any chart time frame.
Range BreakOut Trading Method
To trade the range break out method, the first step is in identifying a tight range determined by the high and low. The easiest way to spot ranging price action is to look for this consolidation right after a previous big move.
The following chart is a EURUSD H4 chart, where the range was specified. We plot the range high/low after a downtrend was established and instead of price dropping further, it begins to move in a flat or sideways direction. If you closely look at the chart, you will find the points 1, 2, and 3.
Point 1 corresponds to the Range high that was plotted after price started moving flat.
Point 2 corresponds to the Range low that was plotted during the course of the sideways price action
Point 3 corresponds to an adjusted Range low
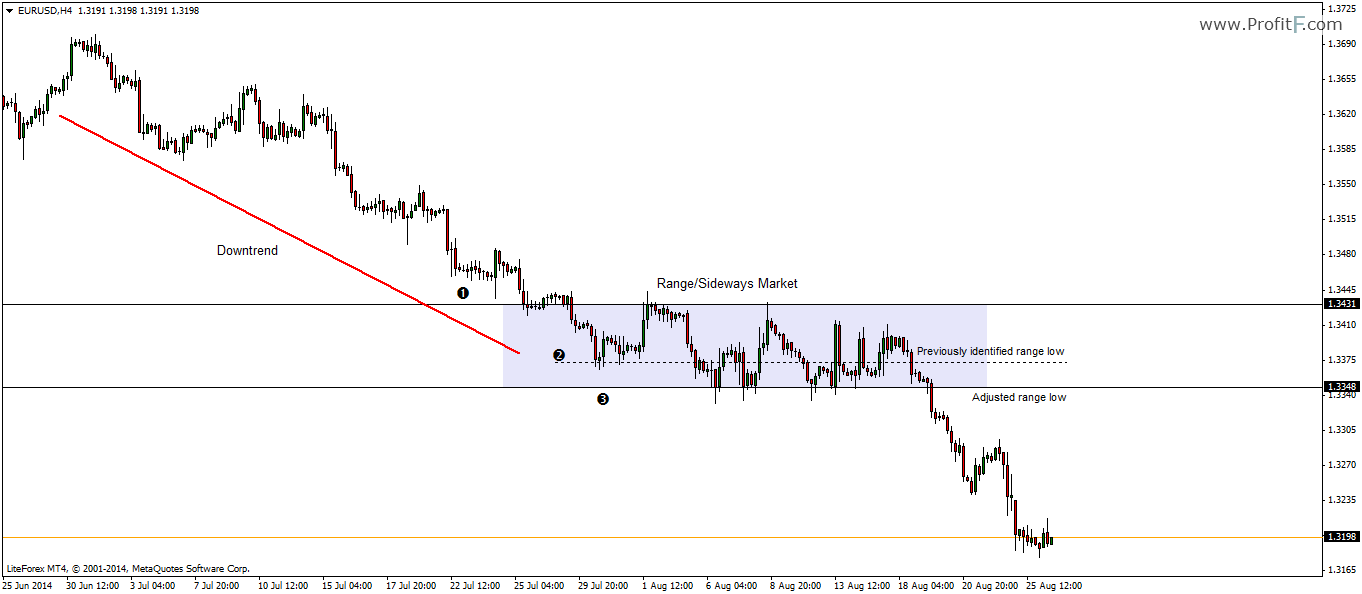
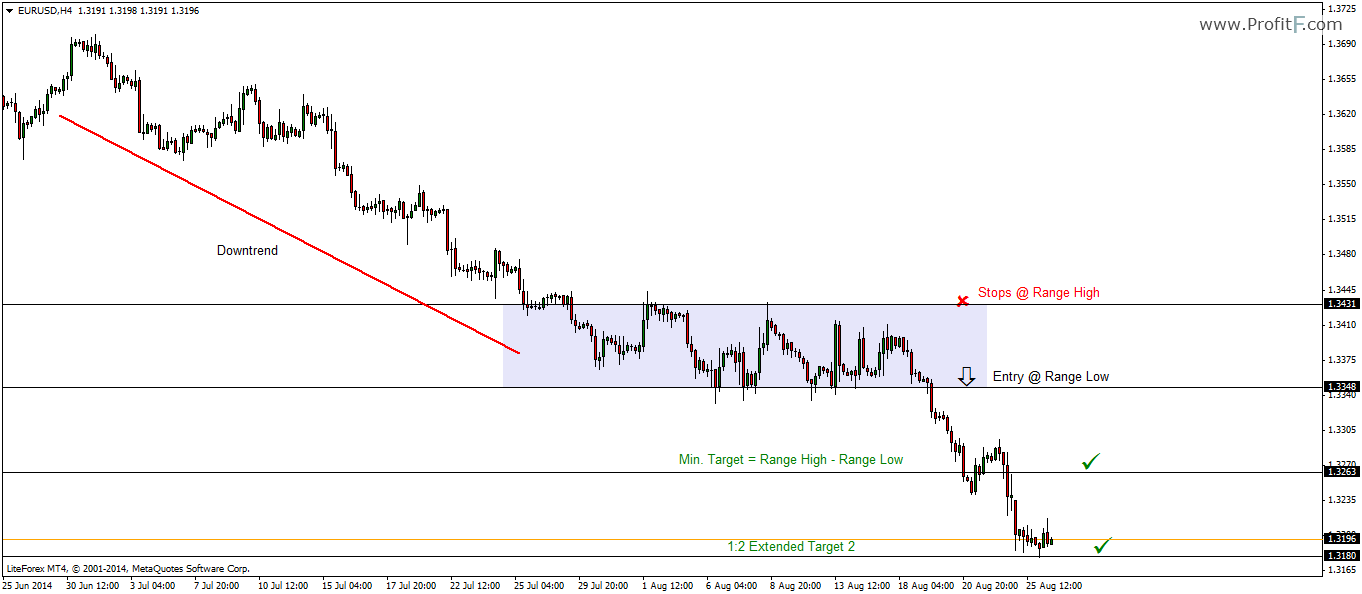
The chart above is how a Range break out chart set up would look like. Now that we have the range high and low in place, the next step is to place the trades.
Because price was in a downtrend, we are more inclined to take a short position. This is done by placing a Sell order at the range low with stops at the range high. The minimum target is the distance of the range (or distance between the entry and the stops). Traders can then move their targets for a 1:2 or 1:3 ratio and trail their stops accordingly.
How do we know if the Range high and low are correct?
To ascertain if the range high and low were plotted correctly, the best way to get confirmation is to look to the left of the chart and see if there was any price interaction at these levels.
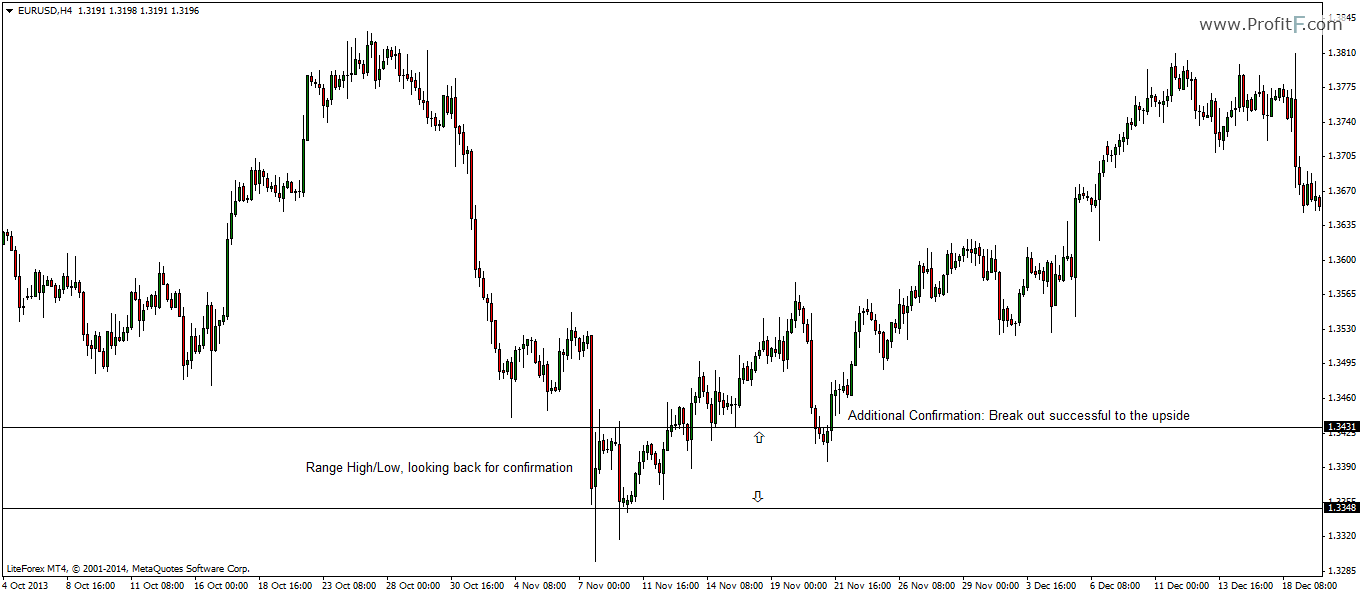
The chart above is nothing but looking back in time with the Range High/Low intact. Notice how price previously formed a minor range and in this case, the break out happened to the upside? This is confirmation that the range high/low that was plotted was correct and indeed price would react one way or another.
Another observation to make from the above chart is that break out can occur in either directions. In the above chart, notice despite a minor downtrend, price stalled and reversed to the upside at the range or consolidation zone.
The Range break out method can be used in any market and in any time frame. Only thing to bear in mind is that range/consolidation phases mean a pause and a continuation of the previous trend or a pause and a reversal to the previous trend.
Session Breakout Method
The session breakout method is very similar to the range break out method. The only difference is that we look for consolidation price action during a trading session. The most popular of session break out methods is the Asian break out method. Because volatility is low during the Asian session, as time progresses and we get nearer to the London session where volatility picks up, prices often consolidate or range during the Asian session. This is especially true for currencies such as EURUSD, GBPUSD, EURCAD, USDCAD and other non Asian currencies such as AUD, NZD.
For the session break out method, 15 minute, 30 minute and 1 hour charts are used. Asian session opens at 00:00 GMT and closes at 09:00GMT. London session starts at 07:00GMT and ends at 16:00GMT. As you can see the overlap of Asian and London session brings a few hours of volatility, making the session break out method very ideal to trade during these time frames.
The chart below is of 30 minutes interval and shows the Asian session and the London session and the overlap periods.
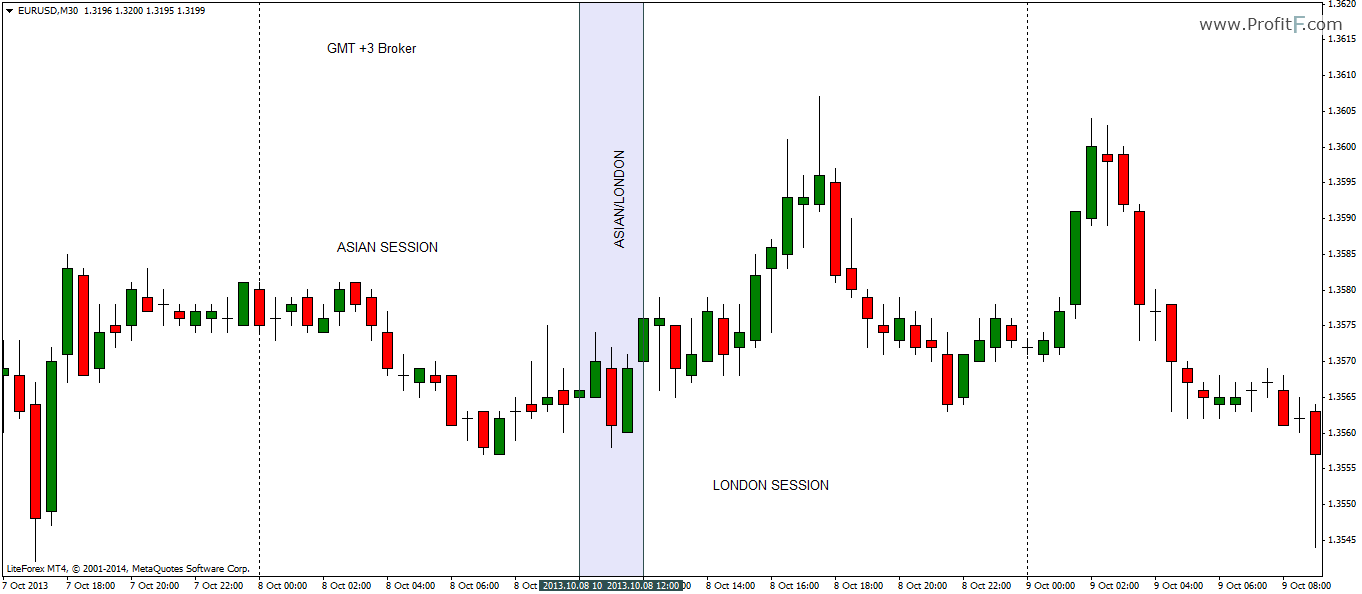
After identifying the Asian session High and Low prices, place two pending orders (Buy and Sell) +/-5pips from the range high low. The target price can be set to 20 pips from entry with the stops at the opposite low. When one order is triggered, cancel the other pending order as shown in the chart below.

The session break out method does not give a good risk/reward but it is the certainty of price moving 20 pips from the range high or low is what makes this method profitable. In the even the ranging price action continues, cancel both orders and wait for the next day’s set up. Make note that this method works only during active London trading session. Therefore do not attempt to trade this method when the UK is closed for a bank holiday as the volatility can be unpredictable. Also, this method works best when there is no news release scheduled. For example, Eurozone news events are usually released in the first two hours of the London session open. So if there is high impact news scheduled, it is better not to trade this system before, after or during the news release. ( ? Read more about Forex Trading the News)
Trend Line Breakout Method
The trend line break out method is based on price action trade set up. Unlike range break out method, trend line break method is used to trade short term corrections or reversals to the previous trend. To trade the trend line break out method, the first step of course involves plotting a trend line on a time frame of your choice. Click here to read more about trend lines. ( ? Read more about Trend Lines Trading )
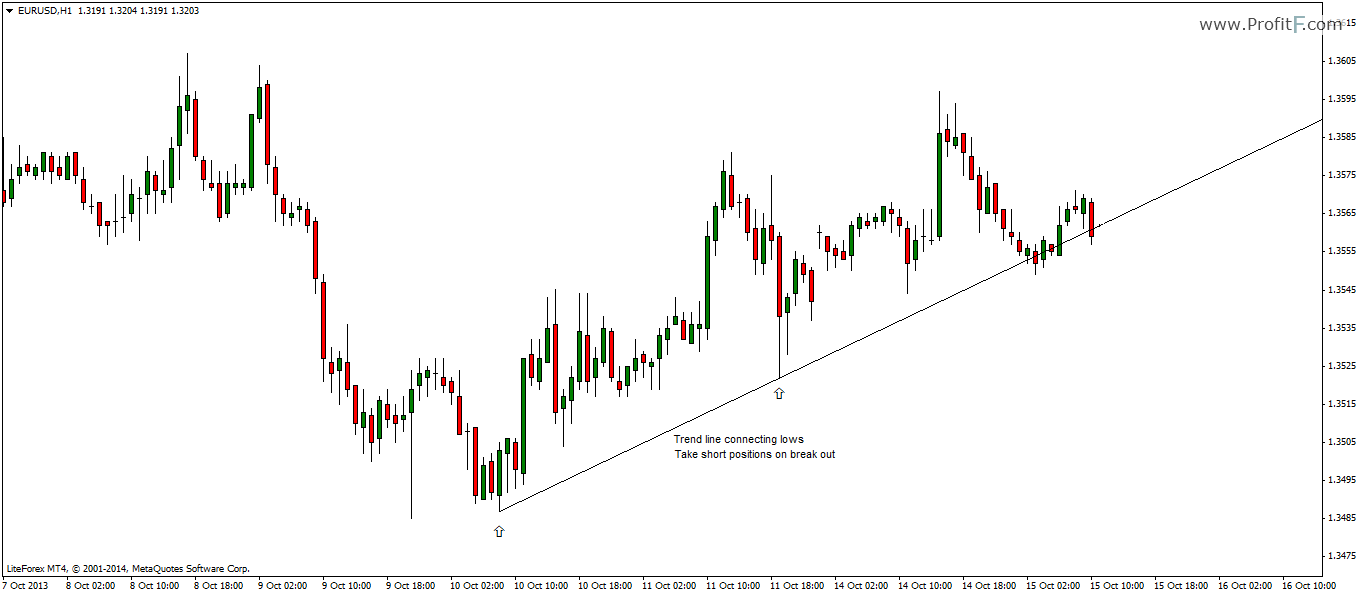
The chart above shows an up sloping trend line that was drawn by connecting two consecutive lows. This tells us to look for short positions when the trend line is broken. There are two ways to trade the trend line break method.
TL Break Method 1: Sell or Buy on immediate breakout with stops at previous high or low, targeting the middle low and finally the initial low (or highs).
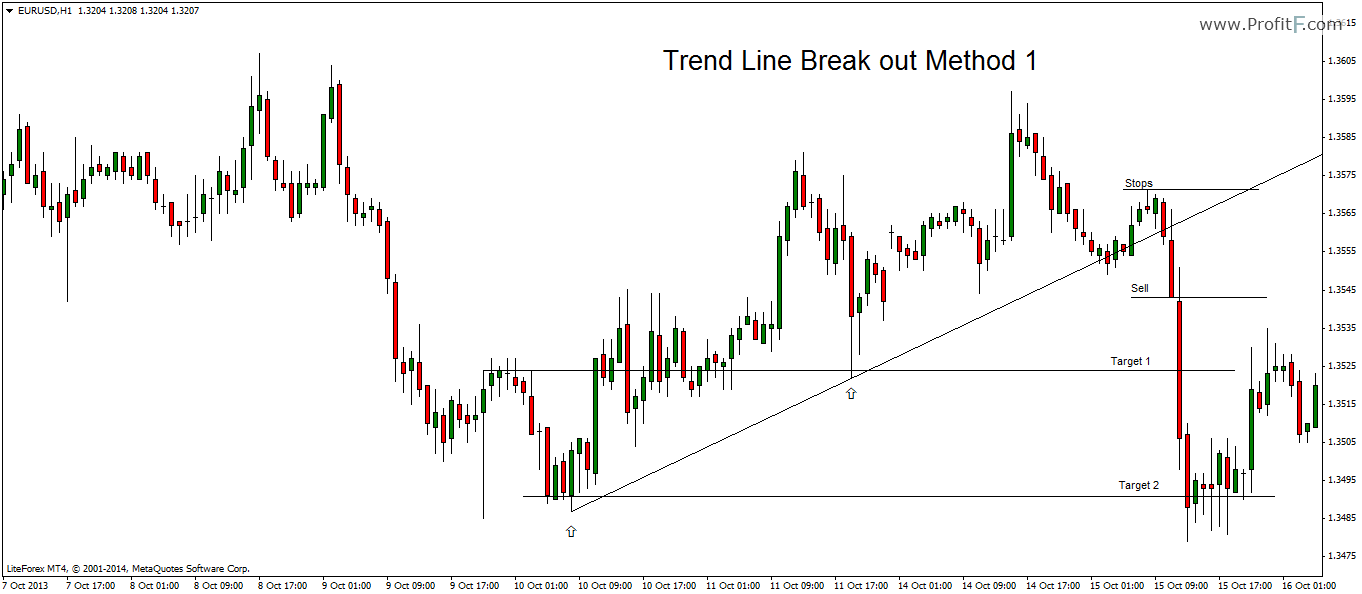
The chart above shows how a sell order was placed after a full candle opened and closed below the trend line with the stops at the recent/previous high and the target 1 at the middle of the trend line and target 2 near the bottom/initial end of the trend line.
This method is a bit risky because prices can break a trend line only to reverse and continue the previous trend.
TL Break Method 2: Wait for a retest of retracement and target the previous move.
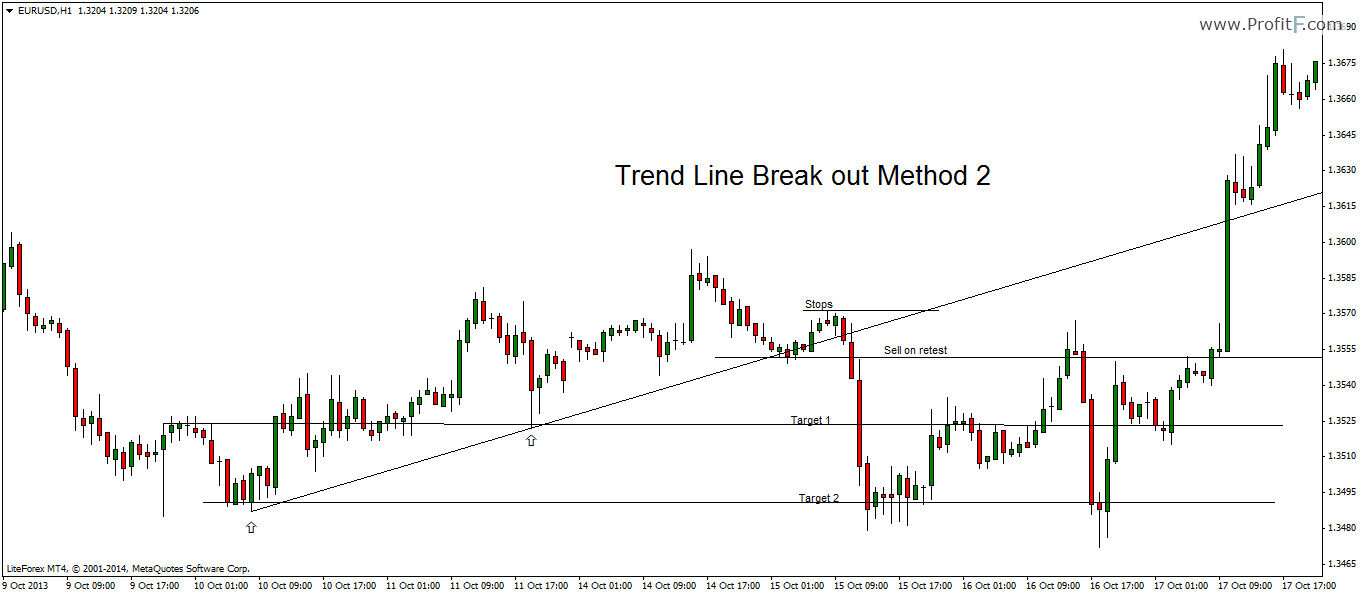
In this second method, we wait for a retest of the break out, which we can see how price rallied back up to test the same price as the initial break out. In this method the targets are well defined. The purpose of Target 1 is to ensure that if price doesn’t reach Target 2, the trade can be closed out as it signals a potential reversal. In the above example, after a retest, price conveniently managed to hit both the targets, making this a safe entry.
In this method, there is a risk of missing out on a trade if price momentum was extreme. In such cases, there are no retracements and thus the trader misses out on a profitable move. However, trading retest of the trend line break outs is a safer approach.
Channel Breakout Method
The Channel break out method is based on the same principles of trend line break out method. The only difference here is that the channel connects highs and lows and therefore is a better way to trade. The only issue with channel break out method is that it takes a lot more time to find the right price channel to trade. This method works on any time frames.
To plot the channel, make use of the equidistant channel, connect two consecutive lows or highs first and then adjust the channel to connect the intermediate high. The chart below shows how the channel is plotted.
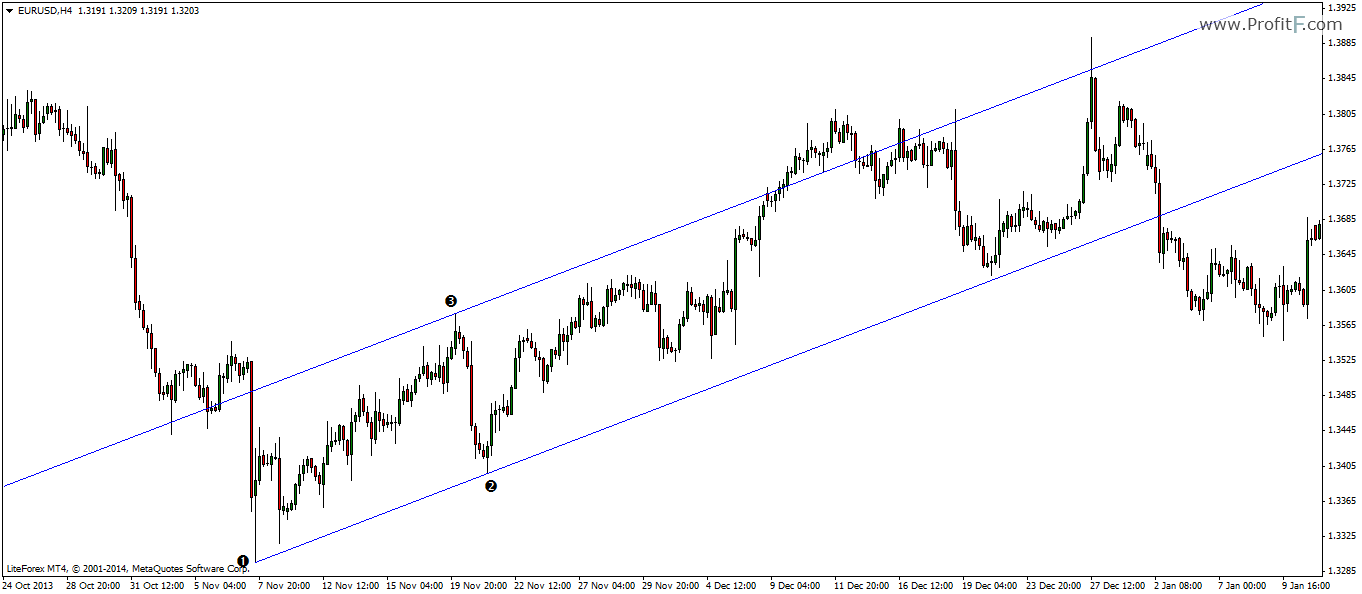
Now that we have the channel in place, the next step is to wait for the right conditions, which is to wait for a break out. In an up sloping channel look for break out of the lower channel line and in a down sloping channel, look for break out of the upper channel line.
In the next chart below we notice how a break out to the downside occurred. We wait for a retest of the break out price level and take a short position with stops at the previous support/resistance levels formed inside the channel. For targets, we look to the bounces or support/resistance levels formed during the channel was formed.
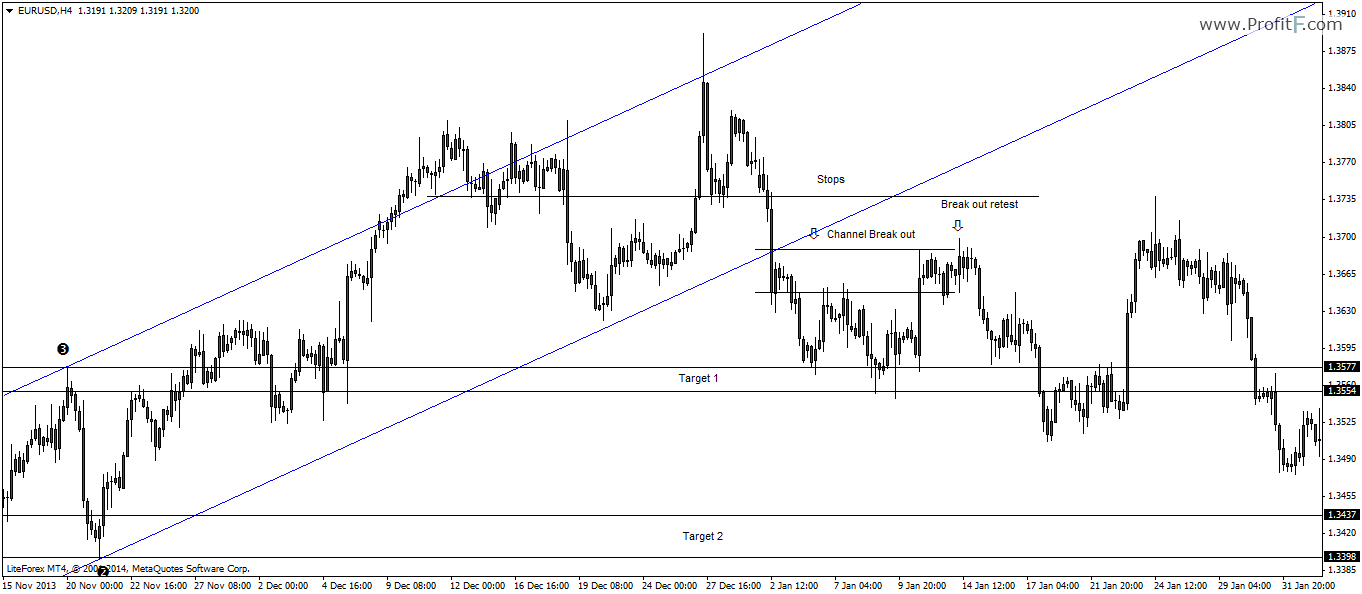
Here we see that price managed to reach only Target 1. This is indicative that we could see a reversal very soon. This gives us another possible trade and we plot a new channel connecting the consecutive highs and lows to give us a down sloping channel.
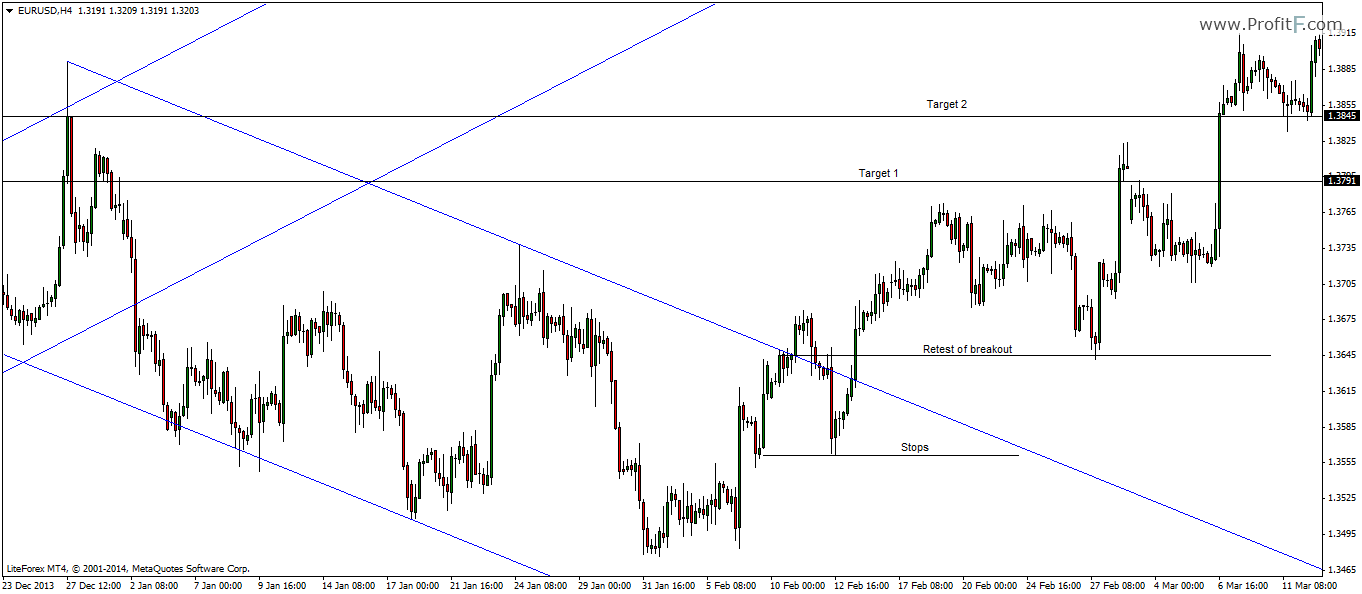
Here we notice how the break out to the upside was retested giving us a long opportunity and this time price rallied all the way to reach Target 2 as well.
Break-out trading strategies – A profitable yet simple approach
From the above different types of breakout trading strategies we can observe that it is easy to trade using break outs, regardless of the type of strategy you make use of. With a good defined risk/reward ratio is most cases, break outs can become easy to trade with enough practice and understanding of various aspects such as trend lines, channels, support and resistance

 (9 votes, average: 4.89 out of 5)