
Double tops and double bottom chart patterns are perhaps the best and easiest of Reversal chart patterns to get accustomed to trading with price action. These two chart patterns are indicative of a reversal and are also visually easy to identify. In this article, we will explain the concepts of double tops and double bottoms and also how to trade them effectively.
What are double tops and double bottoms?
A double top pattern is formed when price tries to rally and fails to break a previous resistance level and a double bottom pattern is formed when price drops but fails to break a previous support level. These chart patterns are very reliable chart patterns and can be traded in isolation. However, traders should bear in mind that there are many instances when a double top or a double bottom pattern can fail. The reliability however ensures that the trading approach using double tops and double bottoms offers a very low risk, high reward ratio.
Identifying Double tops and Double bottoms
The following chart illustrates how a double top or a double bottom pattern visually looks like.

Figure 1: Double Top and Double Bottom Pattern
In order to trade the double top or double bottom patterns, the following rules must be kept in mind.
Double Top Pattern
The chart below gives an illustration of the double top pattern and the projected moves based on the distance of the prior intermediary support.

Figure 2: Double Top Pattern
Double Bottom Pattern
Figure 3 illustrates how to trade the double bottom pattern based on the projected price from the intermediary resistance level from previously established support level.

Figure 3: Double Bottom Pattern
Trading the Double Top and Double Bottom patterns
The following sections illustrate how to trade the double top or double bottom patterns. Note that most traders tend to use the candlestick or bar charts. The problem is that the highs and lows can be a bit misleading. Therefore, a closing line chart is best suited to find double top and double bottom patterns. Although the patterns may not be that common, trading a double top or double bottom pattern using the line chart offers more probability of success.

Figure 4: Double Top Pattern Example
In Figure 4, we have a classic example of a double top pattern identified with a line chart. Here, we can see a sharp reversal from the previously established resistance level. When price breaks the intermediate support formed, a short position is taken, with the price objective being the measured distance between the intermediate support and the main resistance level.
Figure 5 shows the above same pattern but with candlestick chart. Notice how confusing it is to properly identify this same double top pattern formed by the line chart?

Figure 5: Confusing Double Top Pattern in Candlestick charts
In the next chart below, we can see how a double bottom pattern is formed, identified with the line chart. After a break of the intermediary resistance level, we take long position, targeting the measured distance between the established support level to the intermediary resistance level and projected from the break out level.
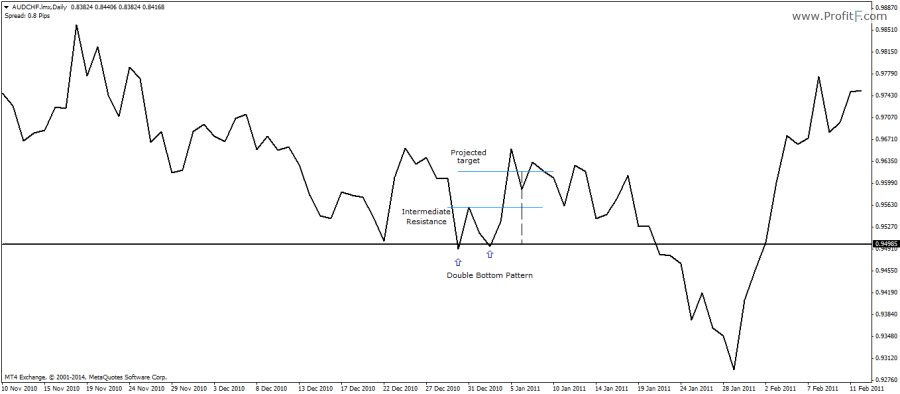
Figure 6: Double Bottom Pattern Example
The double top and double bottom patterns are two reliable chart patterns that can form either towards an exhausted trend or within a consolidation price range. Stops are usually left to the trader’s discretion. An aggressive approach of trading the double tops and double bottoms is to place a buy or sell order at the intermediate support or resistance level or to wait for a pullback, which may or may not happen depending on the strength of the trend.
The double top and double bottom patterns can be traded with trend lines as well, as shown in the chart below.

Figure 7: Double Top Pattern with trend lines
Here we notice how a double top pattern was formed within the two trend lines. While we already get the minimum target of the downside move, an earlier entry could have been taken when the second trend line was broken along with the most immediate support level shown on the chart. This trade would have given a very low risk, high reward trade opportunity.
While double top and double bottom patterns are not 100% reliable, the fact that they can combined with other price action trading ensures that they offer a low risk, high reward trade set ups thus ensuring that the losses are well covered by the winners.


 (10 votes, average: 3.70 out of 5)


can this patterns be traded on any timeframes?