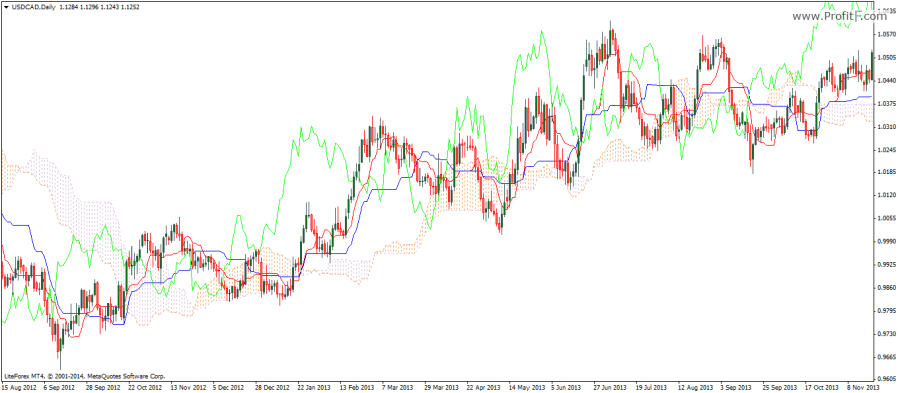
The Ichimoku Kinko Hyo indicator which is also a complete trading system in itself. Roughly translated to price equilibrium, the Ichimoku Kinko Hyo indicator represents current price in relation to past price as well as projects future support and resistance levels. The Ichimoku cloud as it is commonly known was developed in the 1960’s by a journalist, Goichi Hosoda.
The Ichomoku Kinko Hyo indicator comprises of the following components.

The Ichimoku Indicator brings with it, its own trading rules.
– When price is trading above the cloud and the future cloud is sloping upwards, it indicates an uptrend and similarly when price is trading below the cloud with the future cloud sloping downwards, it signifies the downtrend.
– When the Chikou span is trading above price it signals that prices are bullish and bearish when the Chikou span is trading below price.
– The Tenken and Kijun sen bullish and bearish crossovers are the final confirmation to the trade bias.
– When trading with the Ichimoku indicator, all the criterion must be taken into consideration rather than looking at each of the signals individually.
Download Ichimoku Kinko Hyo indicator
Add your review