Moving Average Indicator (MA) is the most popular and widely used indicator in technical analysis. As the name suggests, the moving average plots the mean price of the instrument or security to which is I applied to. The mean price can be applied to any of the four variables, the high, low, open or closing prices.
The Moving Averages come in four variations:

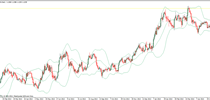
The moving average forms the basis of many trading systems and strategies with the most common being using a longer term and a short term moving average. When the short term moving average cuts above the longer term moving average from below, a long signal is established and when the short term moving average cuts below the longer term moving average, a short signal is triggered. The standard moving averages include 200, 100, 50 and 20 day moving averages on the daily charts, although traders can set up a moving average for any period of their choice.
Download Moving Average indicator

 (15 votes, average: 4.13 out of 5)